Role of agriculture in growth, employment, food production index, and food security reduction.
Africa stands at an essential moment in its economic transformation, with the world’s fastest-growing population and vast natural resources. The continent possesses the foundational resources required for sustained and inclusive growth. Yet, rooted structural challenges such as limited access to finance, infrastructure deficits, volatile commodity markets, and youth unemployment continue to hinder the full realization of this potential. The Africa Grow framework positions the continent’s development around interconnected economic pillars that address both immediate needs and long-term opportunities. By strengthening agriculture, expanding financial inclusion, accelerating digital innovation, promoting sustainable investment principles, unlocking infrastructure, and elevating job-creating industries, Africa can create a pathway toward resilience, progression, competitiveness, and shared prosperity.
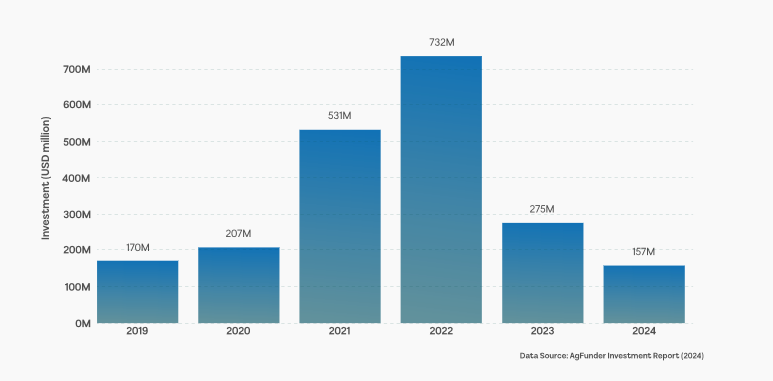
Over the past six years, investment in Africa’s agri-food sector has followed a very different path from global
trends. Funding rose sharply from about $207 million in 2020 to $732 million by 2022 and continued to
decline in 2023 and 2024. This signals a clear shift: agriculture is no longer viewed mainly as a subsistence
activity, but increasingly as a commercial investment opportunity. However, funding is constrained due to
investment risk and long payback risk.
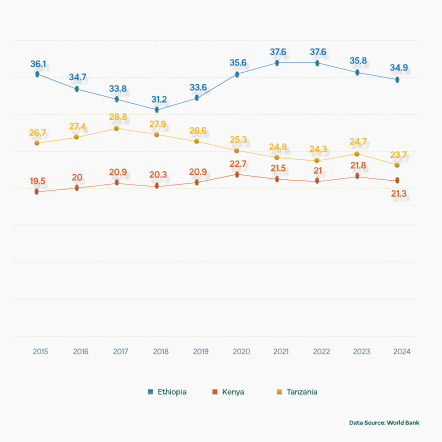
During the same period, the value added by agriculture across Africa more than doubled, rising from roughly $200 billion to about $425 billion according to the Regional Strategic Analysis and Knowledge Support System (ReSAKSS). However, government spending did not increase at the same pace. Recurrent and capital expenditure in agriculture fell to around 2.4% of national budgets by 2020, compared to nearly 4% in the early 2000s, and remains far below the 10% Malabo Declaration target. By 2025, only a handful of countries—Rwanda, Burundi, DR Congo, Ethiopia, and Mali consistently met this commitment Across Africa, agriculture remains a significant part of the economy. According to The Global Economy, the agricultural sector contributed 17.82% of Africa’s GDP on average in 2023, compared to the 15% from 1990 to 2021. East African countries (Ethiopia, Kenya, and Tanzania) have an average agricultural share of GDP of 27.32% from 2015 to 2024.
While these gains positioned the JSE among the stronger-performing large African markets, returns were lower than those of exchanges such as Ghana and Nigeria, where more stable local currencies and sharper valuation re-rating translated into significantly higher USD Return
Ethiopia has a -3.43% percentage change from 2015 to 2024. Tanzania has -12.36% and Kenya 9.23% increment. Also, Ethiopia has the highest agricultural share of GDP, followed by Tanzania and Kenya. There is variation by region: It averaged 24% in Central Africa countries (Cameroon, DR Congo and Chad), 19.48% in Western Africa countries (Nigeria, Cote D’ Ivoire, and Ghana), 11.36% in North Africa countries (Egypt, Algeria, and Morocco), and 10.48% in Southern Africa countries (South Africa, Mozambique, and Zambia). There is instability in the agricultural sector in most African countries.
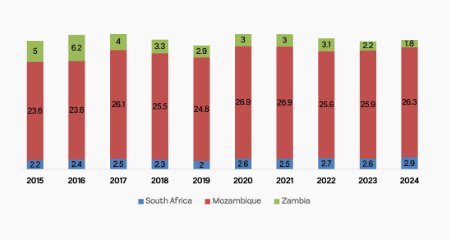
South Africa and Mozambique had an increase in the agricultural share of GDP, 31.81% and 10.27% percentage change from 2015 to 2024. Zambia, on the other hand, had a -64% decline from 2015 to 2024. Since most countries in Africa have had a decline in their share. This just further proves that the African economy is moving to other manufacturing sectors, service, and other industries. Agriculture’s share of GDP has reduced in most African countries, but this does not necessarily mean a reduction in the value of agricultural output. Because in most countries, GDP grows over time, a reduction in share does not mean a reduction in value. Nigeria, for example, had 20.6% in 2015 (#19.64 trillion) and 20.4% in 2024 (#56.4 trillion) according to the Central Bank of Nigeria (CBN) statistical bulletin.
Agricultural employment in North African countries used in the research has declined from what it was in
2015, especially in Egypt (-27%) and Morocco (-17%), while Algeria has remained stagnant.
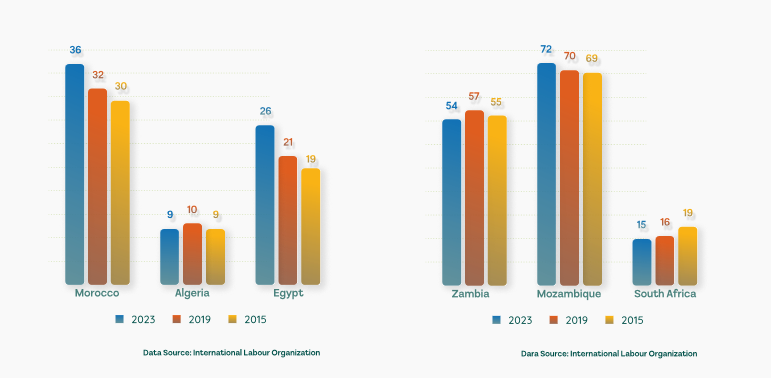
But it is a different scenario in Southern African countries (South Africa, Mozambique, and Zambia). South Africa (26%) and Zambia (1.9%) have seen an increase in agricultural participation by their citizens. Mozambique (-4%) has seen a reduction. You would also notice from the chart below that the participation in Agricultural activities is relatively high compared to North African countries.
Central African countries (Cameroon, DR Congo, and Chad) have relatively higher participation levels than the other zones. It is also important to note that there is a decline in agricultural participation in most African countries over the years.
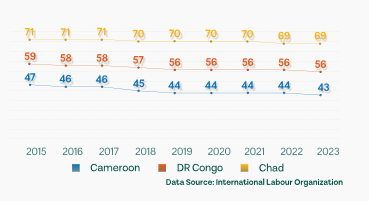
With a -2.82% decline in Chad from 2015 to 2023, Dr Congo -6.78%, and -8.51% decline in Cameroon from 2015
to 2023. These countries have a negative percentage change in the level of agricultural employment, just like
most countries on Africa’s map.
The food production index is the total output of food crops that are considered edible and contain nutrients, e.g., maize, vegetables, etc. Coffee and tea are excluded. The chart below shows the food production level in Southern Africa using 2014 to 2016 as the base year. Southern African countries (South Africa, Mozambique, and Zambia) have seen an increase in food production from 2015 to 2022. Food production across Africa has been unstable across various countries. Aside from the extreme weather and post-harvest loss due to poor storage facilities, Africa is one of the continents with the lowest fertilizer usage. Fertilizer usage is just one of the many factors affecting food production and quantity.
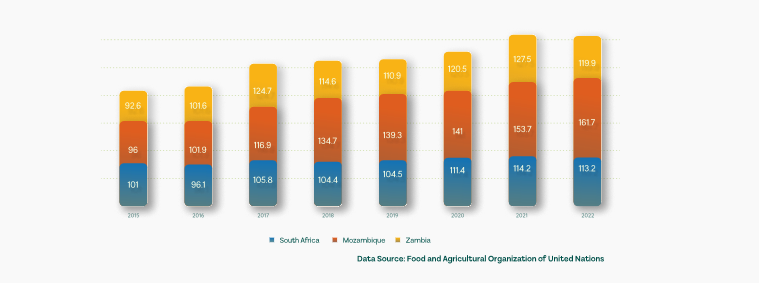
According to the chart above, we can see that there are improvements in the food production index in these countries, despite the reduction in agricultural employment level in Mozambique and Zambia; the level of food production is increasing. A 29.28% increment in Zambia, 68.43% in Mozambique, and 12.1% in South Africa. These indicate an improvement in the level of efficiency in farming operations. Despite low fertilizer usage, are still able to improve by using better tools, techniques, and better storage facilities in Agriculture.
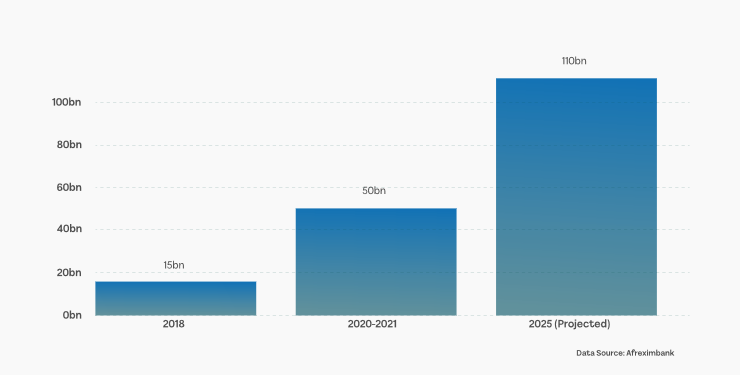
Investor interest has intensified as food security has become a major economic concern. Africa’s food import bill rose from about $35 billion in 2017 to an estimated $110 billion by 2025, with the aim to shore up the gap between domestic food production and the demand for food by the people.
Meanwhile, hunger has been an issue in Africa. The number of undernourished people in Africa has increased a lot from 217.9 in 2018 to 306.5 in 2024, that is a 71% percent increment in 7 years.
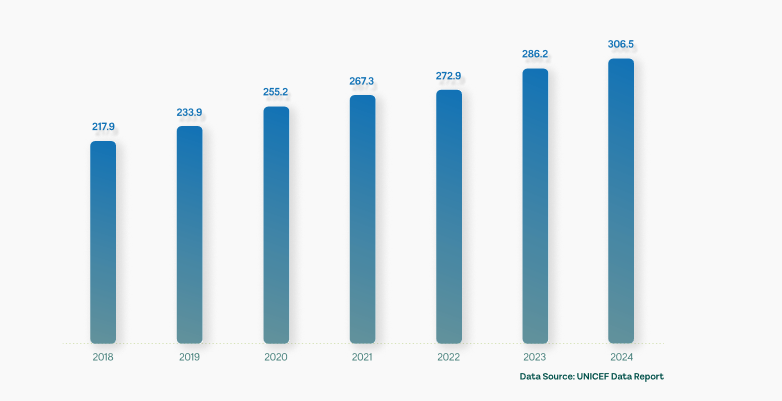
This surge is driven by many factors, including conflicts, climate shocks like droughts and floods, economic instability like inflation, and even the effect of the previous pandemic. The nearly 90 million people increase in just 6 years shows the vulnerability to food insecurity and the challenges in ensuring access to sufficient nutrients.
Hunger has been a general issue impacting each zone in Africa, from the north, west, middle, south, and eastern zones of Africa. Eastern Africa has the largest number of people facing hunger, Western Africa, Middle Africa, North Africa, and Southern Africa.
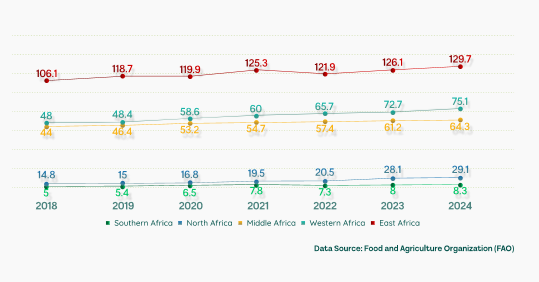
Eastern Africa has the highest number of people facing chronic hunger in Africa, followed by Western Africa, Central Africa, North Africa, and Southern Africa, respectively.
The chart below gives a 3-year interval view of the hunger issues to fully understand the rate at which it is growing, zone.
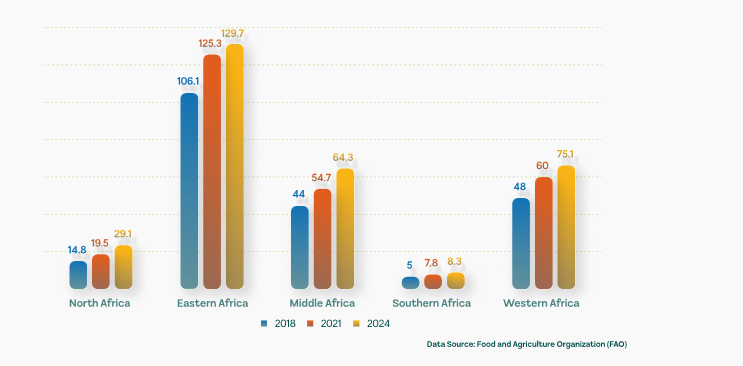
The growth rate in North Africa has almost doubled, with a 97% increment from 2018 to 2024. Southern
Africa 66%, Western Africa 56.5%, Middle Africa 46%, and Eastern Africa 22% during the same time frame,
respectively.
Investment is now focused on three main areas: Technology-driven farming, including agrotech platforms and precision agriculture. Value-chain infrastructure, such as cold storage, food processing, logistics, and fertilizer production. Climate-smart agriculture, supported by growing climate-finance programs.
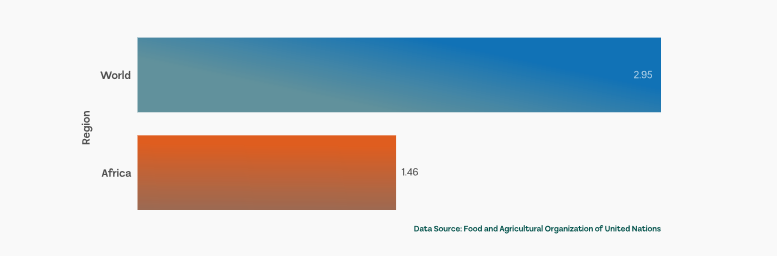
The low level of fertilizer application signals low escalation of agriculture, which constrains yields. According to the Food and Agriculture Organization (FAO), farmers in Africa produce 7kg of Maize per kilogram of N fertilizer nutrients, whereas farmers in North America produce 5 times more.
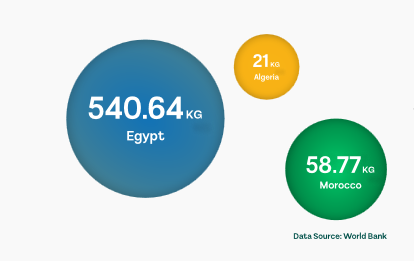
Egypt has a -6.44% change from 2015 to 2023, during the same timeframe Algeria has -11.91%, and Morocco has
-21.84%. This is showing a decline in these 3 nations. Low fertilizer usage means low yields, leading to a shortage
of food and supply pulled inflation.
Fertilizer manufacturing is increasingly moving closer to African markets. Morocco’s OCP Group expanded production capacity by 2025, supporting the African Union goal of increasing fertilizer use from 18 kg per hectare to 54 kg per hectare by 2033, according to Alliance for Food Sovereignty in Africa (AFSA).
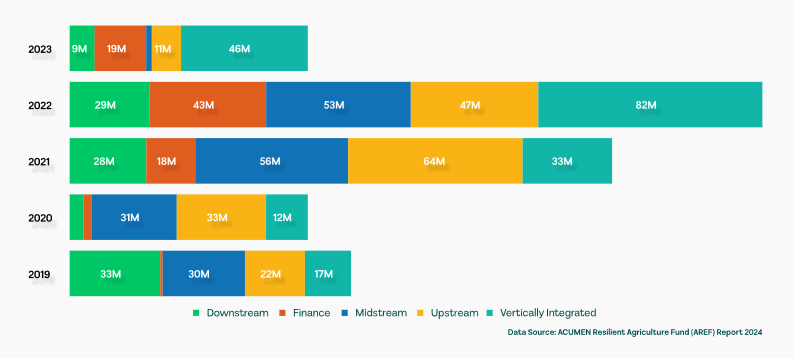
Investment patterns show a shift away from fragmented projects toward integrated and scalable businesses. Between 2019 and 2023, most capital flowed into midstream activities—such as storage, processing, and logistics—because these reduce losses and improve supply-chain efficiency. Vertically integrated companies, combining farming, processing, and distribution, attracted larger investments due to better risk control and market access. At the same time, upstream segments like agritech, seeds, fertilizers, irrigation, and precision tools remained strong. Together, these trends show agriculture moving toward commercially viable, climate-resilient systems that can operate at a regional scale.
This momentum is expected to continue. Africa adds about 15 million working-age people each year, making
reliance on food imports unsustainable. Without major investment, imports could supply 30.4% of food
demand by 2043, compared to 10.6% under high-investment scenarios, according to the ISS African Futures
Agriculture Scenario report. The AfCFTA is improving the economics of regional production and trade, enabling larger, more efficient markets.
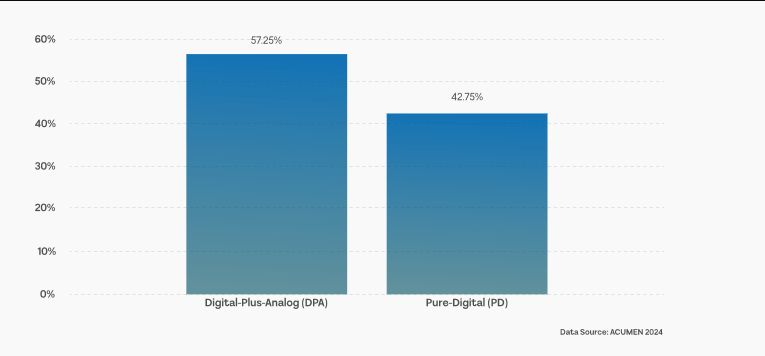
Digital adoption is also supporting growth. Internet use has reached about 44%, and digital payments are helping farmers access credit. As a result, agribusiness is expected to remain a core growth sector, with annual investment of $8–12 billion through 2027
High food inflation, especially in West African countries, shows the vulnerability of households (especially low-income ones) to price shocks. When a large share of expenses is on food, inflation reduces real income and increases food insecurity. The modest growth in food production index across zones in Africa suggests quantity alone can’t solve food insecurity, as lack of quality can lead to reduction in life span, inadequate distribution, affordability, and resilience to extreme climate conditions matter too.
Technology adoption and productivity enhancement
With the low output per hectare of land across the entire continent compared to the rest of the globe. Intensification is the way forward; we need to increase output per hectare by securing better seeds, fertilizers, and proper irrigation structures rather than land expansion. Heavy investments in better digital agricultural equipment’s from electrical payment and credit services to planting and cultivating machines that aid productivity. Given exposure to droughts, floods, land degradation, etc. Africa needs to incorporate resilience to climate change. To achieve food security, especially in West Africa, improving stability of food prices through subsidies and fiscal means, investment in supply chains, and reducing import dependency to boost local production is a must. Investments in infrastructure (irrigation, roads, storage), extension services, access to credit, etc. determines the growth of the sector. Moving beyond producing raw produce to processing and storing will massively reduce post-harvest losses and increase the agricultural share of GDP.
Policy reforms and investment priorities
Tanzania in East Africa introduced “Fertilizer Regulations (controlled oversight)” in 2017, which reportedly increased trade in fertilizer by 47% and reduced fertilizer prices by 10-40% in some regions of the country.
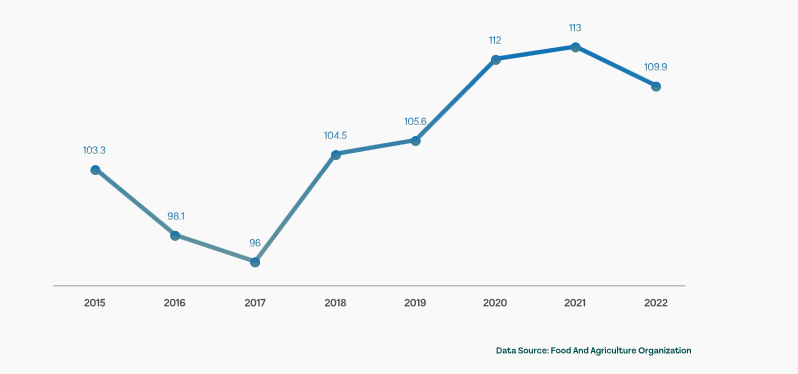
The impact of this reform can be seen in the chart above. There was a surge in food quantity in 2018 and the
years after due to the availability of centralized fertilizers, thereby making it cheaper for farmers. From 2015
to 2017, there was a -7.02% decline in the level of food production. After the reform, 16.67% increment from
2018 to 2022. High fertilizer consumption increases yield and overall output.
Nigeria in West Africa introduced “The Agriculture Promotion Policy (APP 2016-2020)” launched in 2015 with the aim of improving productivity, focusing on export markets, and heavy value-chains integration. As stated earlier, in value chain integration, having a direct impact on post-harvest loss and the percentage of agriculture’s share of GDP.
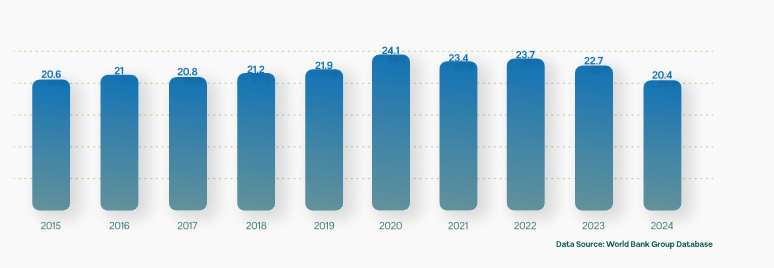
Nigeria enjoyed an increase in agricultural share of GDP from 2015 to 2020, but immediately after the duration of the policy started facing a decline in GDP share. One would say the pandemic played a role, but the impact of ending a policy that provided extra income from the processing, storage, and export of final agricultural products to other countries.
Productivity vs employment vs food security?
Using Southern Africa (South Africa, Mozambique, and Zambia) as a case study. The level of food production
is increasing. A 29.28% increment in Zambia, 68.43% in Mozambique, and 12.1% in South Africa from 2015 to
2022. These indicate an improvement in the level of efficiency in how we farm. Despite low fertilizer usage
compared to the rest of the world, we are still able to improve by using better tools, techniques, and storage facilities. Despite South Africa (26%) and Zambia (1.9%) increment, Mozambique (-4%) reduction in agricultural employment from 2015 to 2023. You would also notice from the previous charts that the number of people facing chronic hunger in Southern Africa 66% from 2018 to 2024.
The number of people facing hunger is moving rapidly, faster than the employment and production benchmarks. Indicating cause for concern, the standard of living continues to drop as inflation and exchange rates continue to rise.