Africa Business Convention Report 2026

Executive Summary

Africa Grow tracks Africa’s growth engines in a changing global economy is an integrated analytical view of Africa’s development trajectory. The report responds to the unification of fast population growth, climate stress, global financial tightening, and geopolitical fragmentation, all of which are raising the stakes for job creation, productivity growth, and macroeconomic stability across the continent. Rather than treating sectors in isolation, the report introduces the Africa Grow Framework, built around six interdependent pillars that jointly determine growth quality, resilience, and inclusiveness

Agriculture and Food Systems (AFS)
Banking , Investment, and Capital (BIC)
Environmental , Social, and Governance (ESG)
Fintech , Innovation, and Technology (FIT)
Jobs, Economy, and Trade (JET)
Power, Infrastructure, and Energy (PIE)

The core objective is to move the Africa growth narrative from potential to performance by identifying where growth is occurring, why it is failing to translate into broad welfare gains, and what structural constraints and accelerators matter most for the next growth phase. The report shows that while Sub-Saharan Africa’s GDP expanded cumulatively between 2015 and 2024, this growth has been volatile and insufficiently transformative. The COVID-19 shock caused a region-wide contraction in 2020, and although output recovered, inflation rose sharply, reducing purchasing power and standard of living. Over the same period, GDP per capita declined, indicating that population growth has outpaced income growth and that average Africans are becoming poorer. This macro pattern frames the central challenge of the report: growth exists, but its quality is poor, as it does not consistently deliver food security, employment, energy access, or income gains.

Download Report

Introduction

Africa stands at an essential moment in its economic transformation, with the world’s fastest-growing population and vast natural resources. The continent possesses the foundational resources required for sustained and inclusive growth. Yet, rooted structural challenges such as limited access to finance, infrastructure deficits, volatile commodity markets, and youth unemployment continue to hinder the full realization of this potential. The Africa Grow framework positions the continent’s development around interconnected economic pillars that address both immediate needs and long-term opportunities. By strengthening agriculture, expanding financial inclusion, accelerating digital innovation, promoting sustainable investment principles, unlocking infrastructure, and elevating job-creating industries, Africa can create a pathway toward resilience, progression, competitiveness, and shared prosperity.

You might ask, why does this report matter? Africa is entering a period of heightened economic urgency. Population growth, climate stress, global capital reallocation, and geopolitical fragmentation are converging at a time when the continent must create jobs, raise productivity, and stabilize living standards at unprecedented scale. Despite abundant potential, growth outcomes across Africa remain uneven, volatile, and insufficiently transformative. This report matters because it moves beyond fragmented sectoral analysis and presents an integrated, evidence-based assessment of Africa’s growth engines and constraints. It identifies not only where growth is occurring, but why it is failing to translate into food security, jobs, energy access, and inclusive prosperity. By grounding the analysis in data across six foundational pillars, the report provides clarity in a complex policy and investment environment. In a context where decisions are increasingly shaped by environmental, social, and government criteria, fiscal constraints, and domestic capacity limits, the pace of development across Africa is. Africa Grow offers a structured lens to prioritize reforms, allocate capital more effectively, and align public and private actions.


Context

The Africa Grow report serves three core functions. It diagnoses Africa’s growth system by assessing the performance and interdependence of six critical pillars: agriculture, banking and capital, environment, social, and governance (ESG), fintech, jobs and trade, and power, energy, and infrastructure using regional and country-level data. This systemic approach reveals where bottlenecks in one pillar undermine progress in others. By translating data into strategic insight rather than presenting data in isolation, the report links quantitative indicators to policy outcomes, investment behaviour, and institutional capacity. It highlights structural accelerators, binding constraints, and cross-sector feedback loops that shape growth trajectories. Also, bridging policy and investment perspectives is relevant to policymakers, investors, development partners, and private-sector leaders. It frames growth challenges in terms of risk, return, resilience, and inclusion.

The Africa Grow report has five primary objectives:
(1) To provide a coherent growth framework by establishing a unified analytical framework that explains Africa’s growth dynamics across interconnected sectors.
(2) To support better decision-making by equipping governments, investors, and development institutions with actionable insights to prioritize reforms, deploy capital, and design interventions with the highest systemic impact.
(3) To identify scalable growth pathways by highlighting policies, technologies, and institutional models that have demonstrated results and can be replicated or scaled across countries and regions.
(4) To align growth with inclusion and sustainability – integrate environment, social, and governance, job creation, and climate resilience into the growth narrative, ensuring that economic expansion translates into social and environmental gains. (5) To shift the narrative from potential to performance by moving the Africa growth discussion from aspirational promise to measurable outcomes, execution capability, possibility, and accountability.


Background

Africa’s economic trajectory is at an essential juncture. Over the past two decades, the continent has recorded periods of strong growth, rising investment interest, and meaningful progress in financial inclusion and infrastructure development. Yet these gains have been uneven, frequently disrupted by external shocks, and insufficient to deliver sustained improvements in productivity, job creation, and living standards at the scale required by Africa’s rapidly expanding population. Africa is home to the world’s youngest and fastest-growing population, with millions of new candidates joining the labour market each year. At the same time, the continent faces persistent structural challenges, including low agricultural productivity, infrastructure and energy deficits, shallow financial systems, climate vulnerability, and high levels of familiarity in employment. These constraints have limited the capacity of economic growth to translate into broad-based development outcomes.
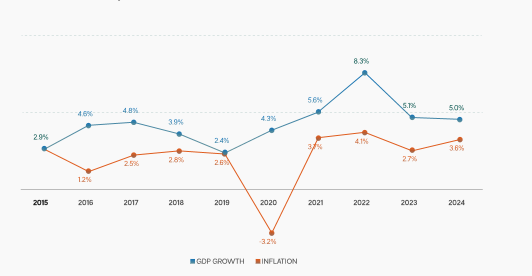
Figure 1.1: GDP and Inflation growth rate in sub-Saharan Africa (ssa) 2015 to 2024


Figure 1 shows the growth rate of Sub-Saharan Africa. GDP suffered a negative growth rate in 2020 across the entire region due to the pandemic lockdown (no export/import). GDP has a 17% growth rate from 2015 to 2024, from $1.69 trillion to $1.98 trillion, respectively, despite the fluctuations. There has been a gradual rise in  inflation during the same time frame, due to factors such as the exchange rate, consumer price index,  demand, and supply pushed inflation. Inflation has an increment of 72% from 2015 to 2024; this significant increase affected the standard of living and also affected businesses.
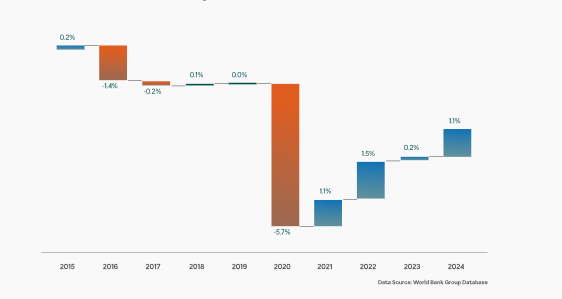
 

Figure 1.2: GDP Per Capita Growth Rate In Sub-Sahara Africa (SSA) 2015 to 2024


Figure 2 has positive growth rate per capita in 2015, 2018, 2021, 2022, 2023, and 2024. Which means the  economy grew faster than the population, or the population growth is slow or declining. The population  growth rate actually declined from 2.7% in 2015 to 2.4% in 2024 according to World Development Indicators  (WDI).
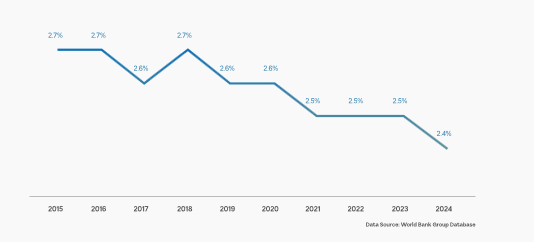
 

Figure 1.3: Population growth rate in sub-Saharan Africa (sSA) 2015 TO 2024


In 2016, 2017, and 2020, the population growth rate rose above the GDP growth rate. A 10-year view shows it is obvious there has been a decline in GDP per capita over the years, and this is not a good sign because it indicates that people are getting poorer on average.

Recent global developments have intensified both the risks and opportunities confronting African economies. Climate change has heightened food insecurity and exposed weaknesses in energy and water systems. Tight global financial conditions and elevated inflation have increased pressure on public finances and reduced fiscal space. Simultaneously, technological advances are particularly in digital finance and mobile connectivity, creating a new pathway for inclusion, domestic capital mobilization, and service delivery. The launch of the African Continental Free Trade Area (AfCFTA) further underscores the potential for regional integration to reshape trade, industrialization, and market scale.

Against this backdrop, sector-specific gains in agriculture, finance, or energy have often failed to deliver lasting impact because progress in one area has been undermined by constraints in others. Sustainable growth in Africa depends on the effective alignment of multiple systems: food and land use, financial intermediation, energy and infrastructure, labour markets, technology, and governance. The Africa Grow report is developed in response to this complexity. It adopts an integrated, data-driven framework that examines six interdependent pillars—Agriculture and Food Systems; Banking, Investment and Capital; Environmental, Social and Governance (ESG); Fintech and Innovation; Jobs, Economy and Trade; and Power, Infrastructure and Energy. Together, these pillars represent the foundational systems through which economic growth is generated, financed, distributed, and sustained.

By analysing performance across regions and countries, the report identifies both accelerators of growth and binding constraints that continue to limit Africa’s development potential. It places particular emphasis on the quality of growth—its ability to generate employment, improve resilience, attract long-term capital, and support social and environmental outcomes—rather than growth rates alone. Ultimately, the Africa Grow report seeks to inform a more strategic and coordinated approach to Africa’s economic transformation. It provides policymakers, investors, development partners, and private-sector actors with a shared analytical basis to prioritize reforms, deploy capital effectively, and shift the growth narrative from potential to performance.


Snapshot assessment of the six pillars (progress, gaps, and risks)

  1. Agriculture and Food Systems (AFS)
    Agriculture remains the economic backbone of Africa, employing a large share of the workforce and contributing close to one-fifth of GDP on average, with even higher shares in East, Central, and West Africa. The report finds:
    Rising investment momentum: Private investment in agri-food systems increased sharply after 2020,  signalling a shift from subsistence farming toward commercial, technology-enabled agriculture. Public  underinvestment: Government spending on agriculture has declined to around 2–3% of national budgets, far  below the 10% target. Productivity gains but uneven outcomes: Food production indices have improved in  several regions despite declining agricultural employment, indicating rising efficiency, but not sufficient to  offset food insecurity.
    Deepening food insecurity: The number of undernourished people in Africa rose  dramatically between 2018 and 2024, driven by conflict, climate shocks, inflation, and supply-chain  weaknesses. The core insight is that productivity improvements alone are not enough. Without fertilizer access access, irrigation, storage, processing, and regional trade integration, rising output does not translate into affordability or nutrition security.
  2. Banking, Investment, and Capital (BIC)
    Africa’s financial system shows cautious resilience: Bank profitability is improving in several regions, supported by digitalization and cost efficiencies, particularly in East and West Africa. Foreign Direct Investment is recovering but remains below pre-pandemic peaks and is increasingly concentrated in energy transition, infrastructure, logistics, and digital sectors. Non-performing loans are trending downward in countries with stronger regulation and digital credit analytics, though they remain elevated in commodity-
    dependent and fragile states. Inflation and currency volatility, especially in parts of West Africa, continue to undermine real returns and long-term investment confidence.
    The report concludes that domestic banking systems are becoming the most reliable source of capital formation, especially in a world of unpredictable global capital flows. However, regional discrepancy risks widening inequalities unless macroeconomic stability and regulatory quality improve.
  3. Environmental, Social, and Governance (ESG)
    ESG is no longer marginal; it is increasingly shaping capital flows and policy choices: Climate vulnerability is rising, particularly for agriculture-dependent and low-income populations. African governments and banks are beginning to adopt ESG disclosure and sustainability frameworks, driven by investor pressure and multidimensional institutions. Renewable energy adoption is expanding, though unevenly, with hydropower and solar leading in different regions. Social investments in health, education, and clean cooking are increasingly framed as economic productivity investments, not just welfare spending.
    The report warns that without stronger governance, data, and disclosure capacity, ESG risks will become symbolic. Regions with weaker institutions face exclusion from growing pools of ESG-aligned capital.
  4. Fintech, Innovation, and Technology (FIT)
    Africa is a global leader in mobile-money-led financial inclusion: Financial account ownership has risen rapidly, driven primarily by mobile money rather than traditional banking. Digital payments per adult have increased sharply, supporting formalization, SME activity, and household resilience. Fintech ecosystems have matured, with clear hubs in East and West Africa and growing spillovers into digital credit, savings, and micro-insurance. Infrastructure gaps and regulatory capacity remain constraints in Central and parts of North Africa.
    The report finds that fintech has moved from access to impact, but sustained productivity gains will depend on digital trust, consumer protection, and interoperable regional payment systems.
  5. Jobs, Economy, and Trade (JET)
    Employment is the central pressure point of Africa’s growth report: Africa adds millions of working-age people annually, yet job creation falls behind population growth. Energy costs and logistics historically constrained manufacturing and trade, but the African Continental Free Trade Area (AfCFTA) is reshaping incentives for regional value chains and industrialization. Informality remains dominant, limiting productivity,tax capacity, and worker protection.
    The report stresses that without structural transformation toward higher-productivity sectors, economic growth will continue to generate insufficient and insecure jobs, especially for youth.
  6. Power, Infrastructure, and Energy (PIE)
    Energy and infrastructure are identified as binding constraints across all other pillars: Energy insufficiency continues to limit industrial growth, digital adoption, and service delivery. Renewable energy presents a major opportunity, supported by falling costs and new financing models. Infrastructure financing gaps remain large, but mixed finance and regional integration offer scalable solutions.
    The key insight is that no pillar can succeed without reliable power and infrastructure, making this a foundational enabler of growth.


Key Cross-Pillar Strategic Insights

The report’s central contribution lies in showing how the six pillars interact as a system:

  • Fintech amplifies banking efficiency and job creation
  • Energy access determines the viability of agriculture processing, manufacturing, and digital services.
  • ESG standards increasingly shape capital availability across all sectors.
  • Weakness in power or governance pillars undermines progress in others.
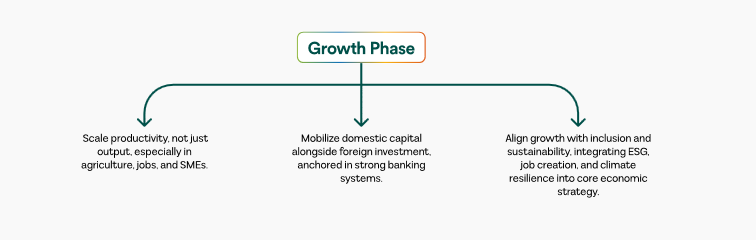


How the six pillars jointly shape growth outcome

Agriculture and Food Systems remain the backbone of African economies, employing the majority of the workforce and contributing significantly to GDP. The Africa Grow pillar focuses on modernizing agricultural value chains, adopting climate-smart technologies, improving market access, and boosting productivity to achieve food sovereignty across the continent. Strengthening food systems is key to reducing poverty, promoting health, and ensuring long-term economic stability.

Banking, Investments, and Capital in Africa’s financial landscape are expanding, but access to capital remains uneven. This pillar aims to build robust banking systems, deepen capital markets, and unlock investment flows for businesses and infrastructure. Priority areas include financial inclusion, SME financing, investment-friendly regulatory environments, and innovative financing mechanisms capable of supporting large-scale development.

Environmental, Social, and Governance sustainability is no longer optional. This pillar emphasizes the integration of ESG principles into public policy, corporate strategy, and investment decision-making. By strengthening governance, promoting social inclusion, and adopting environmentally responsible practices

African institutions can improve resilience, attract global capital, and ensure that growth benefits people and planet.

Fintech, Innovation, and Technology in Africa are global frontrunners in mobile banking and an emerging hub for tech innovation. This pillar aims to connect digital transformation to expand financial access, improve service delivery, financial inclusion, and support entrepreneurship. It focuses on digital infrastructure, regulatory innovation, data governance, and the scaling of homegrown tech solutions.

Jobs, Economy, and Trade with the continent’s youth population set to double by 2050, job creation is a central development priority. This pillar emphasizes skills development, entrepreneurship, manufacturing, and expanded intra-African trade under the African Continental Free Trade Area (AfCFTA). Strengthening labour markets and productive sectors will ensure Africa’s economic growth is inclusive, self-motivated, and global-market ready.

Power, infrastructure, and energy in Africa are changing as reliable energy and modern infrastructure are essential for industrialization and digital growth. This pillar focuses on bridging Africa’s energy gap through renewable resources, expanding sustainable infrastructure, and improving logistics networks. Strategic investments in power, transport, water, and digital systems will support competitiveness and unlock vast economic potential.
AFS – Agriculture and Food Security

Role of agriculture in growth, employment, food production index, and food security reduction.

Africa stands at an essential moment in its economic transformation, with the world’s fastest-growing population and vast natural resources. The continent possesses the foundational resources required for sustained and inclusive growth. Yet, rooted structural challenges such as limited access to finance, infrastructure deficits, volatile commodity markets, and youth unemployment continue to hinder the full realization of this potential. The Africa Grow framework positions the continent’s development around interconnected economic pillars that address both immediate needs and long-term opportunities. By strengthening agriculture, expanding financial inclusion, accelerating digital innovation, promoting sustainable investment principles, unlocking infrastructure, and elevating job-creating industries, Africa can create a pathway toward resilience, progression, competitiveness, and shared prosperity.
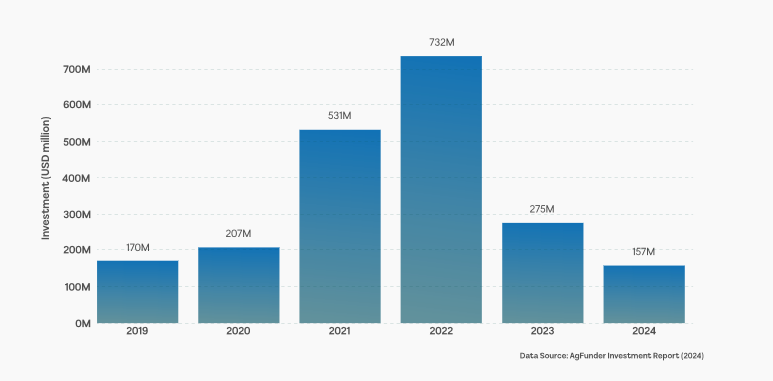
Over the past six years, investment in Africa’s agri-food sector has followed a very different path from global
trends. Funding rose sharply from about $207 million in 2020 to $732 million by 2022 and continued to
decline in 2023 and 2024. This signals a clear shift: agriculture is no longer viewed mainly as a subsistence
activity, but increasingly as a commercial investment opportunity. However, funding is constrained due to
investment risk and long payback risk.

Figure 2.1: Africa AGR-Food Tech Investment


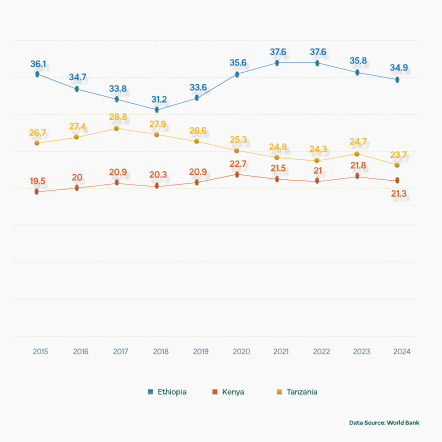
During the same period, the value added by agriculture across Africa more than doubled, rising from roughly $200 billion to about $425 billion according to the Regional Strategic Analysis and Knowledge Support System (ReSAKSS). However, government spending did not increase at the same pace. Recurrent and capital expenditure in agriculture fell to around 2.4% of national budgets by 2020, compared to nearly 4% in the early 2000s, and remains far below the 10% Malabo Declaration target. By 2025, only a handful of countries—Rwanda, Burundi, DR Congo, Ethiopia, and Mali consistently met this commitment Across Africa, agriculture remains a significant part of the economy. According to The Global Economy, the agricultural sector contributed 17.82% of Africa’s GDP on average in 2023, compared to the 15% from 1990 to 2021. East African countries (Ethiopia, Kenya, and Tanzania) have an average agricultural share of GDP of 27.32% from 2015 to 2024.


Figure 2.2: Agricultural Percentage of GDP in East Africa

While these gains positioned the JSE among the stronger-performing large African markets, returns were lower than those of exchanges such as Ghana and Nigeria, where more stable local currencies and sharper valuation re-rating translated into significantly higher USD Return

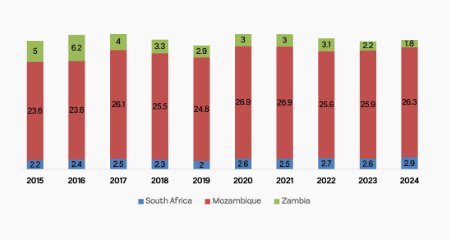
Ethiopia has a -3.43% percentage change from 2015 to 2024. Tanzania has -12.36% and Kenya 9.23% increment. Also, Ethiopia has the highest agricultural share of GDP, followed by Tanzania and Kenya. There is variation by region: It averaged 24% in Central Africa countries (Cameroon, DR Congo and Chad), 19.48% in Western Africa countries (Nigeria, Cote D’ Ivoire, and Ghana), 11.36% in North Africa countries (Egypt, Algeria, and Morocco), and 10.48% in Southern Africa countries (South Africa, Mozambique, and Zambia). There is instability in the agricultural sector in most African countries.

Figure 2.3: Agricultural Percentage of GDP in South Africa


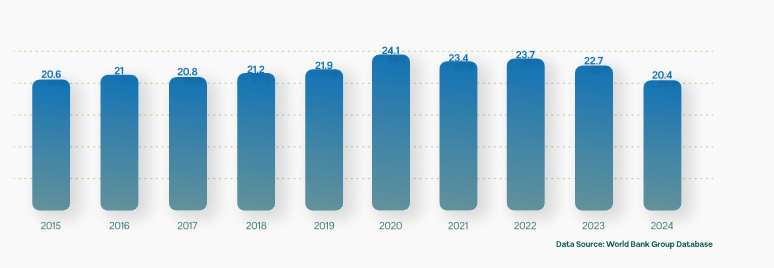
South Africa and Mozambique had an increase in the agricultural share of GDP, 31.81% and 10.27% percentage change from 2015 to 2024. Zambia, on the other hand, had a -64% decline from 2015 to 2024. Since most countries in Africa have had a decline in their share. This just further proves that the African economy is moving to other manufacturing sectors, service, and other industries. Agriculture’s share of GDP has reduced in most African countries, but this does not necessarily mean a reduction in the value of agricultural output. Because in most countries, GDP grows over time, a reduction in share does not mean a reduction in value. Nigeria, for example, had 20.6% in 2015 (#19.64 trillion) and 20.4% in 2024 (#56.4 trillion) according to the Central Bank of Nigeria (CBN) statistical bulletin.

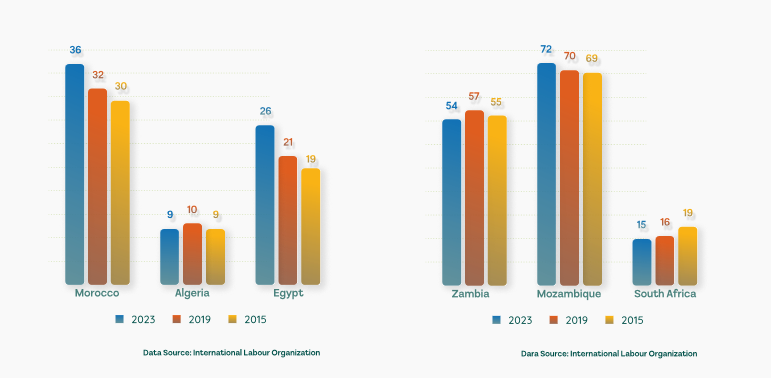
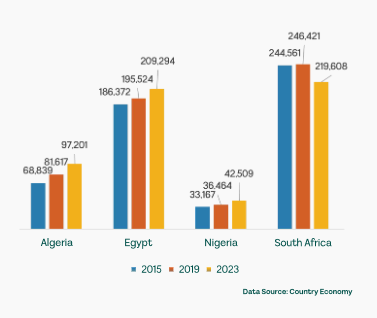
Agricultural employment in North African countries used in the research has declined from what it was in
2015, especially in Egypt (-27%) and Morocco (-17%), while Algeria has remained stagnant.


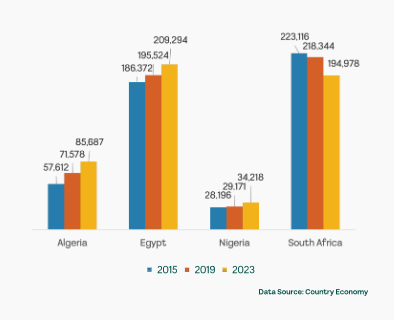
Figure 2.4: Percentage of Agricultural Employment in North Countries 2015, 2019 vs 2023                                                  Figure 2.5: Percentage of Agricultural Employment in South Countries 2015, 2019 vs 2023


But it is a different scenario in Southern African countries (South Africa, Mozambique, and Zambia). South Africa (26%) and Zambia (1.9%) have seen an increase in agricultural participation by their citizens. Mozambique (-4%) has seen a reduction. You would also notice from the chart below that the participation in Agricultural activities is relatively high compared to North African countries.

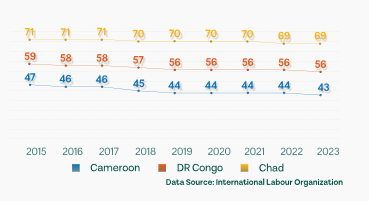
Central African countries (Cameroon, DR Congo, and Chad) have relatively higher participation levels than the other zones. It is also important to note that there is a decline in agricultural participation in most African countries over the years.

Figure 2.6: Percentage of Agricultural Employment in Central Countries 2015 to 2023

With a -2.82% decline in Chad from 2015 to 2023, Dr  Congo -6.78%, and -8.51% decline in Cameroon from 2015
to 2023. These countries have a negative percentage  change in the level of agricultural employment, just like
most countries on Africa’s map.

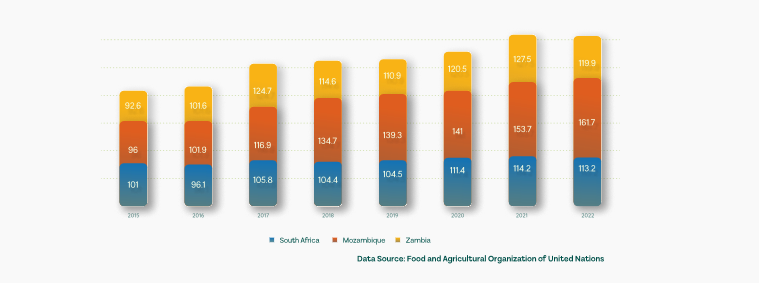
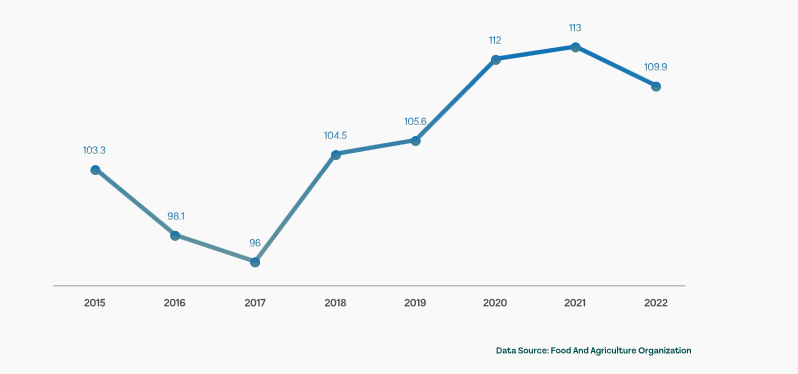
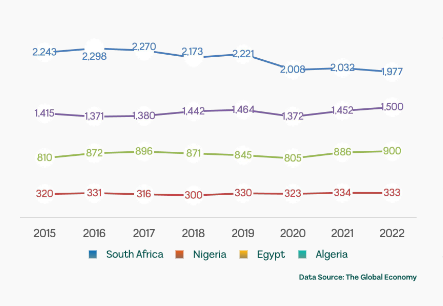
The food production index is the total output of food crops that are considered edible and contain nutrients, e.g., maize, vegetables, etc. Coffee and tea are excluded. The chart below shows the food production level in Southern Africa using 2014 to 2016 as the base year. Southern African countries (South Africa, Mozambique, and Zambia) have seen an increase in food production from 2015 to 2022. Food production across Africa has been unstable across various countries. Aside from the extreme weather and post-harvest loss due to poor storage facilities, Africa is one of the continents with the lowest fertilizer usage. Fertilizer usage is just one of the many factors affecting food production and quantity.


Figure 2.7: Food Production Index in Southern Africa 2015 to 2022 (%)


According to the chart above, we can see that there are improvements in the food production index in these countries, despite the reduction in agricultural employment level in Mozambique and Zambia; the level of food production is increasing. A 29.28% increment in Zambia, 68.43% in Mozambique, and 12.1% in South Africa. These indicate an improvement in the level of efficiency in farming operations. Despite low fertilizer usage, are still able to improve by using better tools, techniques, and better storage facilities in Agriculture.


Figure 2.8: Government Expenditure Average Annual Change 2015 to 2022 (%)


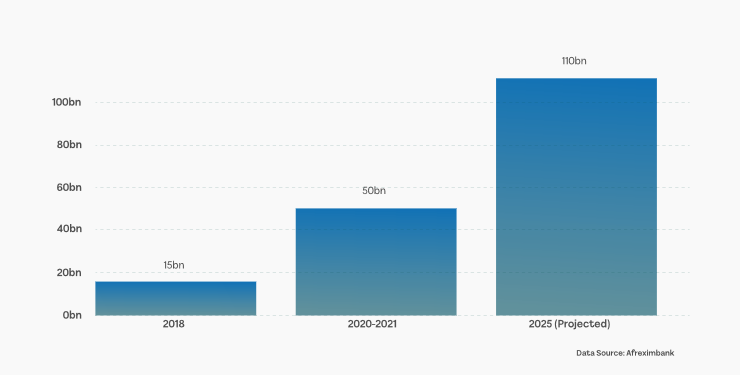
Investor interest has intensified as food security has become a major economic concern. Africa’s food import bill rose from about $35 billion in 2017 to an estimated $110 billion by 2025, with the aim to shore up the gap between domestic food production and the demand for food by the people.


Figure 2.9: Food Import Bill ($ Billion)


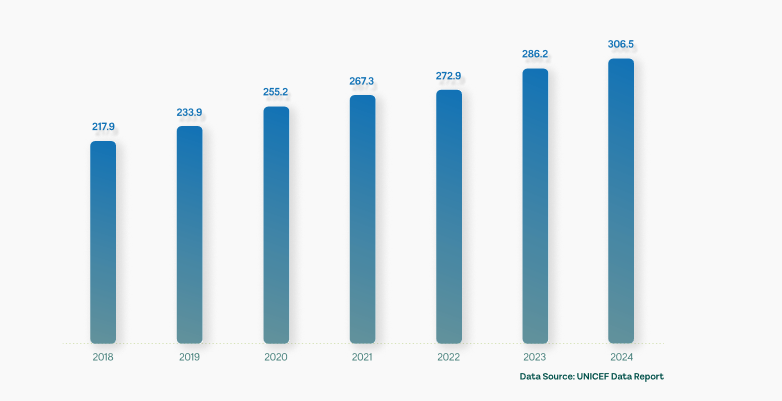
Meanwhile, hunger has been an issue in Africa. The number of undernourished people in Africa has increased a lot from 217.9 in 2018 to 306.5 in 2024, that is a 71% percent increment in 7 years.


Figure 2.10: The number of people facing chronic hunger in Africa (millions).


This surge is driven by many factors, including conflicts, climate shocks like droughts and floods, economic instability like inflation, and even the effect of the previous pandemic.  The nearly 90 million people increase in just 6 years shows the vulnerability to food insecurity and the challenges in ensuring access to sufficient nutrients.

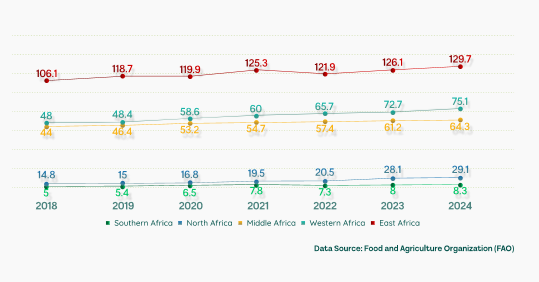
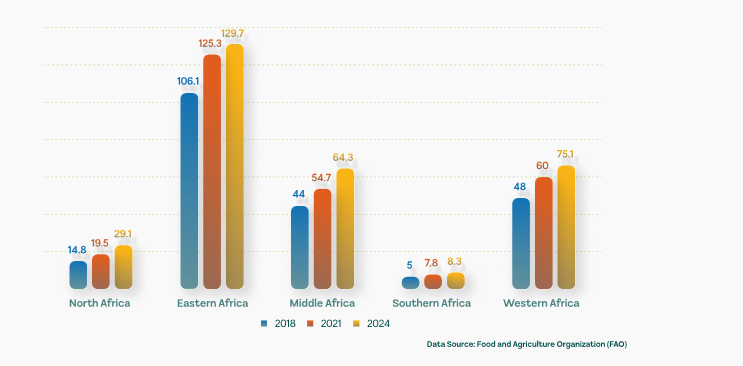
Hunger has been a general issue impacting each zone in Africa, from the north, west, middle, south, and eastern zones of Africa. Eastern Africa has the largest number of people facing hunger, Western Africa, Middle Africa, North Africa, and Southern Africa.

Figure 2.11: Number of People facing chronic hunger in each zone

Eastern Africa has the highest number of people facing chronic hunger in Africa, followed by Western Africa, Central Africa, North Africa, and Southern Africa, respectively.

The chart below gives a 3-year interval view of the hunger issues to fully understand the rate at which it is growing, zone.


Figure 2.12: Number of Undernourished people in each zone (3 years Gap)


The growth rate in North Africa has almost doubled, with a 97% increment from 2018 to 2024. Southern
Africa 66%, Western Africa 56.5%, Middle Africa 46%, and Eastern Africa 22% during the same time frame,
respectively.

Investment is now focused on three main areas: Technology-driven farming, including agrotech platforms and precision agriculture. Value-chain infrastructure, such as cold storage, food processing, logistics, and fertilizer production. Climate-smart agriculture, supported by growing climate-finance programs.

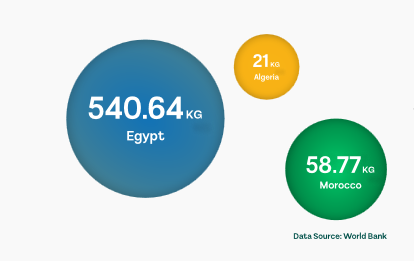
The low level of fertilizer application signals low escalation of agriculture, which constrains yields.  According to the Food and Agriculture Organization (FAO), farmers in Africa produce 7kg of Maize per kilogram of N fertilizer nutrients, whereas farmers in North America produce 5 times more.


Figure 2.13: Average Fertilizer Consumption per Hectare in Egypt, Algeria, and Morocco from 2015-2023


Egypt has a -6.44% change from 2015 to 2023, during the  same timeframe Algeria has -11.91%, and Morocco has
-21.84%. This is showing a decline in these 3 nations. Low  fertilizer usage means low yields, leading to a shortage
of food and supply pulled inflation.

Fertilizer manufacturing is increasingly moving closer to African markets. Morocco’s OCP Group expanded production capacity by 2025, supporting the African Union goal of increasing fertilizer use from 18 kg per hectare to 54 kg per hectare by 2033, according to Alliance for Food Sovereignty in Africa (AFSA).

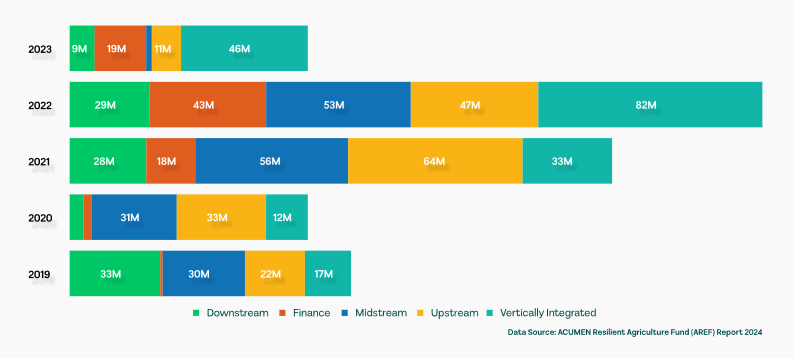
Figure 2.14: Africa Agrifoodtech Investment by Business Model, 2019 to 2023 ($Million)


Investment patterns show a shift away from fragmented projects toward integrated and scalable businesses. Between 2019 and 2023, most capital flowed into midstream activities—such as storage, processing, and logistics—because these reduce losses and improve supply-chain efficiency. Vertically integrated companies, combining farming, processing, and distribution, attracted larger investments due to better risk control and market access. At the same time, upstream segments like agritech, seeds, fertilizers, irrigation, and precision tools remained strong. Together, these trends show agriculture moving toward commercially viable, climate-resilient systems that can operate at a regional scale.

This momentum is expected to continue. Africa adds about 15 million working-age people each year, making
reliance on food imports unsustainable. Without major investment, imports could supply 30.4% of food
demand by 2043, compared to 10.6% under high-investment scenarios, according to the ISS African Futures
Agriculture Scenario report. The AfCFTA is improving the economics of regional production and trade, enabling larger, more efficient markets.


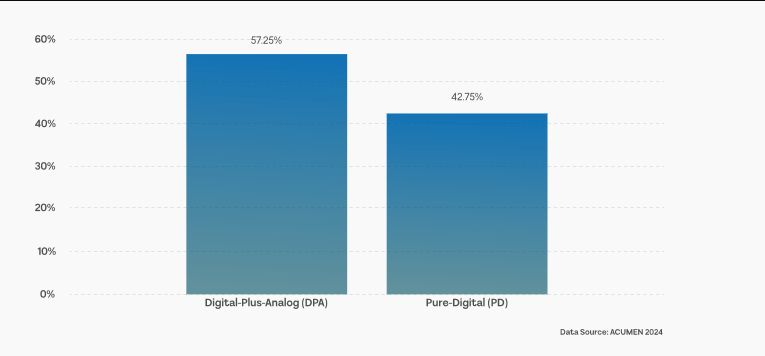
Figure 2.15: Share of Agrifoodtech Funding: Digital-Plus-Analog Vs Pure-Digital


Digital adoption is also supporting growth. Internet use has reached about 44%, and digital payments are helping farmers access credit. As a result, agribusiness is expected to remain a core growth sector, with annual investment of $8–12 billion through 2027

High food inflation, especially in West African countries, shows the vulnerability of households (especially low-income ones) to price shocks. When a large share of expenses is on food, inflation reduces real income and increases food insecurity. The modest growth in food production index across zones in Africa suggests quantity alone can’t solve food insecurity, as lack of quality can lead to reduction in life span, inadequate distribution, affordability, and resilience to extreme climate conditions matter too.


Technology adoption and productivity enhancement

With the low output per hectare of land across the entire continent compared to the rest of the globe. Intensification is the way forward; we need to increase output per hectare by securing better seeds, fertilizers, and proper irrigation structures rather than land expansion. Heavy investments in better digital agricultural equipment’s from electrical payment and credit services to planting and cultivating machines that aid productivity. Given exposure to droughts, floods, land degradation, etc. Africa needs to incorporate resilience to climate change. To achieve food security, especially in West Africa, improving stability of food prices through subsidies and fiscal means, investment in supply chains, and reducing import dependency to boost local production is a must. Investments in infrastructure (irrigation, roads, storage), extension services, access to credit, etc. determines the growth of the sector. Moving beyond producing raw produce to processing and storing will massively reduce post-harvest losses and increase the agricultural share of GDP.


Policy reforms and investment priorities

Tanzania in East Africa introduced “Fertilizer Regulations (controlled oversight)” in 2017, which reportedly increased trade in fertilizer by 47% and reduced fertilizer prices by 10-40% in some regions of the country.


Figure 2.16: Food Production Index in Tanzania 2015 to 2022


The impact of this reform can be seen in the chart above. There was a surge in food quantity in 2018 and the
years after due to the availability of centralized fertilizers, thereby making it cheaper for farmers. From 2015
to 2017, there was a -7.02% decline in the level of food production. After the reform, 16.67% increment from
2018 to 2022. High fertilizer consumption increases yield and overall output.

Nigeria in West Africa introduced “The Agriculture Promotion Policy (APP 2016-2020)” launched in 2015 with the aim of improving productivity, focusing on export markets, and heavy value-chains integration. As stated earlier, in value chain integration, having a direct impact on post-harvest loss and the percentage of agriculture’s share of GDP.


Figure 2.17: Agricultural Percentage of GDP in Nigeria 2015 to 2024


Nigeria enjoyed an increase in agricultural share of GDP from 2015 to 2020, but immediately after the duration of the policy started facing a decline in GDP share. One would say the pandemic played a role, but the impact of ending a policy that provided extra income from the processing, storage, and export of final agricultural products to other countries.


Productivity vs employment vs food security?

Using Southern Africa (South Africa, Mozambique, and Zambia) as a case study. The level of food production
is increasing. A 29.28% increment in Zambia, 68.43% in Mozambique, and 12.1% in South Africa from 2015 to
2022. These indicate an improvement in the level of efficiency in how we farm. Despite low fertilizer usage
compared to the rest of the world, we are still able to improve by using better tools, techniques, and  storage facilities. Despite South Africa (26%) and Zambia (1.9%) increment, Mozambique (-4%) reduction in  agricultural employment from 2015 to 2023. You would also notice from the previous charts that the number  of people facing chronic hunger in Southern Africa 66% from 2018 to 2024.

The number of people facing hunger is moving rapidly, faster than the employment and production benchmarks. Indicating cause for concern, the standard of living continues to drop as inflation and exchange rates continue to rise.


BIC-Banking, Investment, and Capital

State of Africa’s banking and financial systems

Africa’s financial landscape is undergoing a structural evolution shaped by profitability ratios, external capital flows, financial stability indicators, and macro-price dynamics. The interplay of Return on Assets, Foreign Direct Investment, Non-Performing Loans, and inflation reveals an uneven but generally improving trajectory across the continent’s regions. These metrics collectively brighten how banks are adapting, how investors are allocating capital, and how countries are building resilience. Taking a look into Africa’s economy via Investment climate, regulation, and financial stability.

Return on Assets measures how efficiently a bank uses all of its assets to generate profit. From buildings, vehicles, to computers, etc., because they are used in carrying out daily operations that generate profit. Return on Assets across African banks has been slowly rising after COVID-19 disruptions, supported by digitalization, better cost controls, and recovery in credit demand. Return on equity measures the return of stakeholders’ shares in businesses, including banks. Return on equity across regions ranged from about 15% in North Africa to 32% in West Africa, according to the Africa Development Bank (AFDB) in 2023. It is important to acknowledge the regional deviation; East and West Africa are showing the strongest ROA improvements, helped by fintech-led cost efficiencies, especially mobile banking. North Africa remains stable but is moderated by high sovereign exposure. While Central Africa shows a weaker return on assets owing to concentrated banking sectors and higher operating costs.


Figure 3.1: Return on Assets in West and East African Countries


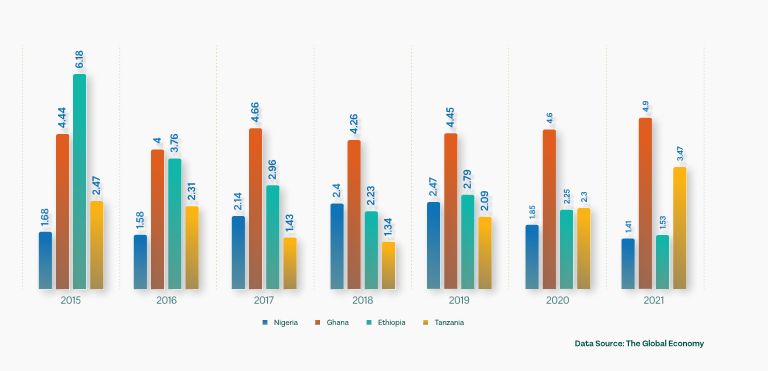
There has been a -16% reduction in return on assets in Nigeria, Ethiopia -75% from 2015 to 2021, while there
have been 10% and 40% increment in Ghana and Tanzania, respectively, during the same duration. These  suggest many African banks remain fairly profitable despite macroeconomic headwinds. High return on  assets, especially in countries like Ghana and Tanzania, indicates good conditions for investors, which can attract more capital and support bank expansion.

Figure 3.2: Return on Assets in West African Countries

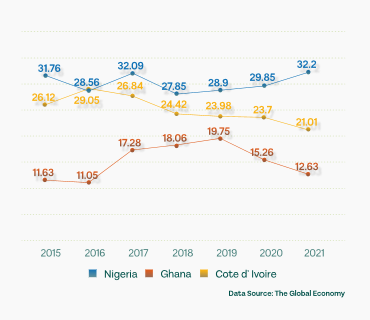
Investors in Nigeria, Ghana, and Côte d’Ivoire enjoy considerable returns on their investments in the long run due to profitable environments in the banking industry in the Western region. North Africa has steady but limited improvement due to heavy public-sector lending. West Africa, on the other hand, has return on assets generally trending upward as cross-border banking groups scale, thanks to the low operating costs of mobile banking and money. East Africa’s strong upward trajectory is supported by digital credit and telecom partnerships. Central Africa is slightly improving, as structural inefficiencies still limit growth. While Southern Africa is moderately improving, as banks rebalance away from interest income toward fee-based services. Banks are having more profitable portfolios, shifting toward small and medium enterprises with digital retail lending, restructuring capital Formation to boost bank profits, increase retained earnings, and support credit extension for infrastructure and private-sector projects.

Foreign Direct Investment shows the level of external confidence in the economy, which directly impacts capital inflows and long-term economic commitments. FDI flows are recovering but remain below pre-pandemic peaks. Investors are shifting focus from extractive industries toward manufacturing, renewables, logistics, and digital infrastructure.


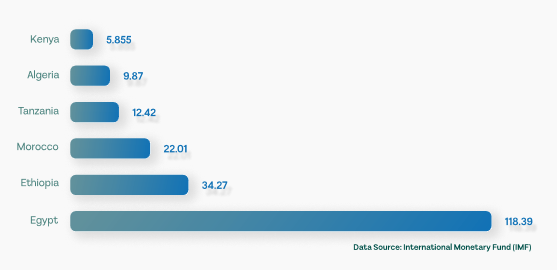
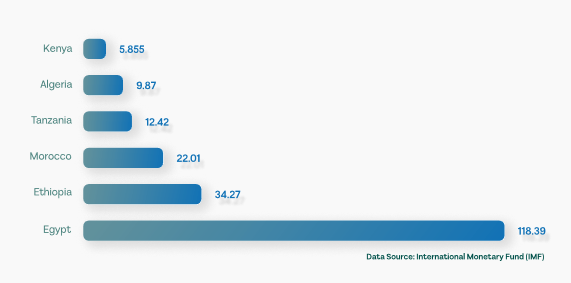
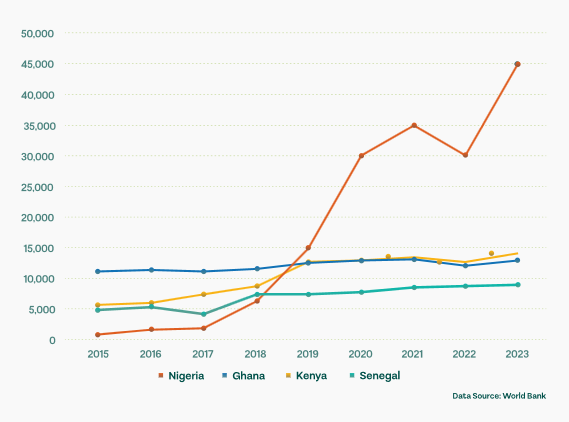
Figure 3.3: Total Sum of FDI in Some Easy and North African Countries From 2015 to 2024 (N Billion $)


East and North Africa currently attract the most diversified FDI. Egypt in North Africa has a total sum of $118 billion from 2015 to 2024. It is important to note that each country in Africa had a downturn in 2020 due to the pandemic. While Egypt has the highest sum and Kenya has the lowest, the common drivers of foreign direct investments in these countries are public infrastructure investments (often state-led), value chain investments, and clean power/
energy investments. Stronger FDI inflows lower the cost of capital, create employment, and support technology transfer. Meanwhile, weak foreign direct investment, especially in Central Africa, reflects continued governance and regulatory risks.

Direction We Are Heading: North Africa is seeing rising foreign direct investment into energy transition projects (green hydrogen in Egypt, Morocco). East Africa’s stability increase is driven by tech, agribusiness, and regional trade integration. West Africa’s political transitions and currency pressures constrain inflows. In Central Africa, FDI inflows are weak and volatile, dominated by extractives. In Southern Africa, FDI is characterized by gradual recovery, with renewables as a source of inflows. Looking into the impacts by Sector, Banks prefer foreign direct investment increases because it improves demand for financial services, liquidity, and encourages competitive lending. For Investors, greater portfolio diversification and an increased craving for private equity. Capital Formation, foreign direct investment enhances domestic savings, accelerating industrialization, infrastructure growth, and boosts gross domestic product.

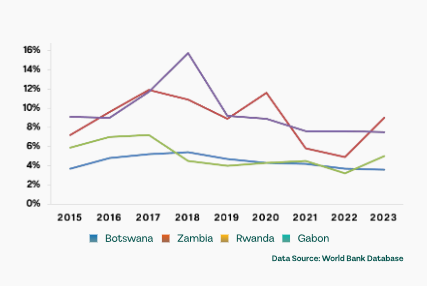
While Non-Performing Loans levels remain elevated in several countries but trend downward in regions adopting stronger credit analytics and regulatory reforms. In 2023, it ranges from 6% in Southern Africa to13% in Central Africa, according to the African Development Bank. The same report notes that banking sectors across the continent were characterized by “lower nonperforming loan ratios”, a positive signal. Post-pandemic legacy effects are still visible in tourism-dependent economies (North and East Africa).


Figure 3.4: Non-performing Loan in Southern and Central African Countries


Since the post-pandemic period, Botswana has had a steady non-performing loans rate. Zambia had a 28% increment from 2015 to 2023. Rwanda and Gabon have both managed to reduce non-
performing loan levels from 2015 to 2023; that’s a sign that non-performing loans could be lowered with the right policies.

High non-performing loans reduce banks’ appetite to lend, leading to tighter credit conditions. Declining NPLs indicate stronger borrower health and better risk management. In some country-specific instances, NPL levels are lower: a recent review of an East African banking sector (Tanzania) reported an NPL ratio at 5% in 2024. Africa is heading towards a better era. North Africa is stabilizing NPLs, but they remain moderately high due to public-sector debt exposure. West Africa is declining but still elevated due to macro volatility, especially in Nigeria and francophone zones.

East Africa is improving due to better credit scoring, mobile banking, and data analytics. Central Africa is high and stubborn due to reliance on commodity-linked lending. Southern Africa is declining slowly as economies recover from energy and logistics bottlenecks. Impacts by Sector: Lower non-performing loan ratios in banks improve profitability, reduce provisioning costs, and allow reallocation to productive credit. For Investors, they avoid regions with persistent high non-performing loans. Non-performing loans declines attract private equity and fixed-income capital. In Capital Formation, lower credit risk expands lending capacity for SMEs and infrastructure.

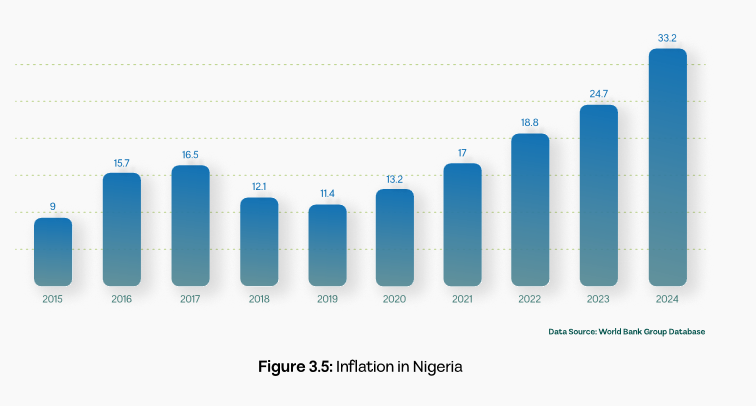
The inflation level in each country around the world has an impact on the level of profitability of capital  investments. For example. Nigeria’s inflation level was up by 33% in 2024 from the previous year, while the  return on investment for the national treasury bill was 20%. This means while the investor made a profit, the  purchasing power of the capital and profit was lower than it was the previous year because the return on  investment was below the inflation level. According to the World Bank, median consumer-price inflation in Sub-Saharan Africa fell from a post-COVID high to about 4.5% in 2024, down from 7.1% in 2023.


Figure 3.5: Inflation in Nigeria


From 2015 to 2020 (pre-pandemic), Nigeria was able to keep inflation in check. From 2021 to 2024 (post-
pandemic) cost of living has been on a rapid rise, reducing the purchasing power of its citizens.


Figure 3.5: Inflation in Nigeria


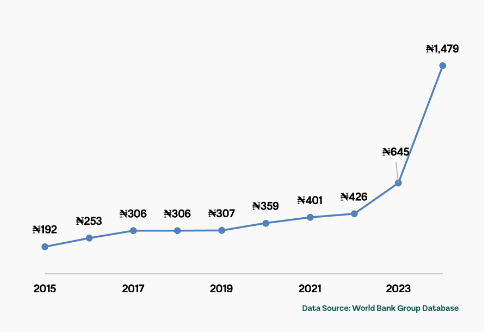
The exchange rate in Nigeria has depreciated by 770% against the US dollar from 2015 to 2024. This is a huge loss of value of the naira in the long-term view, and this is a huge red flag for investors seeking long-term investments in the country. This, coupled with inflation, will affect the level of capital inflow, assets, foreign direct investments, and even stop banks from giving out loans to individuals and businesses, especially when the increment in the exchange rate exceeds the interest rate on loans. They would rather buy dollars rather than give Naira to individuals, small and medium enterprises.

Inflation is moderating across several regions but remains above target in many economies. Food and energy price volatility remains a major driver. High inflation and exchange rate erode purchasing power, increase interest rates, and raise loan defaults. Lower inflation and exchange rates improve banking stability and investor confidence. North Africa is moderating as subsidies and monetary tightening stabilize price levels. East Africa gradual easing but remains vulnerable to climate and currency pressures. West Africa is mixed as Nigeria’s inflation remains high; some countries in the zone see better stability in inflation and exchange rate. Central Africa moderating as commodity revenues strengthen currencies. Southern Africa has sticky inflation, but within manageable bounds for South Africa and Botswana.


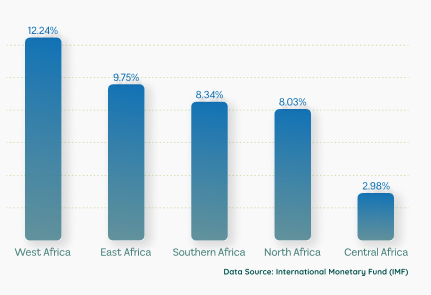
Figure 3.6: Average Inflation Level Across Zone From 2015 to 202


West Africa has the highest average inflation  with 12.24% in 9 years, followed by East Africa 9.75%, Southern Africa 8.34%, Northern Africa  8.03%, and Central Africa 2.98%. For Banks, high inflation forces restrictive monetary policy,  shrinking credit growth. For investors, inflation volatility pushes foreign investors to safer regions or USD-denominated assets. High inflation deters long-term investment and  increases project financing costs.


Strategic actions to deepen capital formation

Resilience of Banking Sector in the continent signals profitability, adequate capital buffers, and moderated non-performing loans, suggesting that Africa’s banking sector is roughly stable. That stability provides a foundation for mobilizing domestic savings, extending credit to the private sector, and supporting enterprise growth. In effect, banks can serve as engines of capital allocation, which is crucial where external financing may be uncertain. Improved macroeconomic environment enhances investment appeal. The downward trend in inflation across much of Sub-Saharan Africa from double-digit peaks to median mid-single digits improves the macroeconomic environment. Lower inflation reduces uncertainty, improves real returns, and allows for lower real interest rates, which together enhance attractiveness to both domestic investors and foreign capital seekers. Regional divergence is a barrier to uniform capital growth; the wide variation across zones (in non-performing loans, return on equity, and banking health) highlights that Africa is not uniform. Capital accumulation, investment flows, and banking-led growth will likely concentrate in sub-
regions with stronger financial and macro fundamentals. Regions lagging on these metrics risk being left behind, exacerbating regional disparities in growth, investment, and development.

Importance of Local Credit, Domestic Banking, and Financial Deepening, given that global foreign direct investment flows are volatile and increasingly constrained by global rate cycles and geopolitical uncertainty, a healthy domestic banking sector becomes even more critical. Well-capitalized banks with low non-performing loans and stable returns can mobilize domestic capital, fund infrastructure, small and medium enterprises, and support broader economic development even if foreign capital is scarce. Policy sensitivity is needed for prudential regulation and macroeconomic Stability. The interplay between inflation, interest rates, bank profitability, and financial stability is delicate. As noted by AfDB, tight monetary policies to curb inflation may strengthen price stability but can also strain banks if credit growth slows or borrowers default. This reinforces the need for prudent regulation, risk management, and macroeconomic coordination.


Is capital deepening and flowing into productive sectors?

Overall, the recent data paint a cautiously optimistic picture: Africa’s banking sector appears resilient, shaped by profitability, adequate capital, improving asset quality, and a gradually stabilizing macroeconomic environment (inflation). This sets a foundation for improved domestic capital mobilization and lending, both critical for investment, business expansion, and long-term growth. So yes, capital is flowing into productive sectors like infrastructure investments, value chain investments, and renewable energy/power. However, progress will likely remain uneven across zones. Regions like West Africa, Southern Africa, and parts of East Africa seem best positioned to attract both domestic and foreign capital, while Central Africa and weaker economies may struggle unless they improve banking-sector soundness, governance, and macroeconomic stability. In a global environment of tightening financing conditions and shifting investor sentiment, the robust performance of domestic banks could become one of Africa’s most reliable levers for sustainable development, provided policymakers and regulators preserve financial stability, encourage credit growth prudently, and support economic diversification.

ESG – Environmental, Social, and Governance

Environmental sustainability and climate adaptation

Environmental, Social, and Governance dynamics are increasingly shaping Africa’s development trajectory, investment landscape, and long-term economic resilience. Environmental pressures from climate change, biodiversity loss, and pollution are intensifying, threatening livelihoods and economies heavily reliant on natural resources and agriculture. On the social front, ESG is promoting greater attention to financial inclusion, labour standards, community welfare, and social infrastructure. The growth of social and sustainability-linked ties across the continent is helping channel capital toward other sectors. In terms of governance, African countries and financial institutions are beginning to adopt more robust ESG disclosure standards and corporate-governance practices driven by pressure from global investors, development banks, and regulatory reforms. Overall, ESG is emerging as a transformative framework for Africa, influencing capital flows, guiding sustainable development, and shaping how governments and businesses manage risk. The continent is moving gradually toward greater transparency, climate-resilience, and social impact, though the pace varies across regions.


Climate vulnerability/adaptation readiness indices

There is rising recognition among African policymakers, financiers, and international development institutions that ESG (and particularly environmental risks) must be integrated into finance and development planning. In 2024, Africa Development Bank (AfDB) organized the inaugural Africa ESG Forum to promote continent-wide ESG disclosure and adoption of sustainable practices. Africa is increasingly engaging with natural-capital accounting and ecosystem services frameworks, under initiatives such as the Global Program on Sustainability (GPS) of the World Bank, signalling a shift from viewing the environment solely as a cost/constraint to integrating environmental assets into economic planning. This means the rise of ESG-aligned financing (bonds, green/social investment) signals that environmental considerations are becoming part of the mainstream financing and investment budgets. This helps channel capital toward climate-resilient, sustainable projects (renewables, conservation, infrastructure, social housing, etc.) rather than only resource-extraction or high-impact industries.

There has been a -16% reduction in return on assets in Nigeria, Ethiopia -75% from 2015 to 2021, while there  have been 10% and 40% increment in Ghana and Tanzania, respectively, during the same duration. These suggest many African banks remain fairly profitable despite macroeconomic headwinds. High return on assets, especially in countries like Ghana and Tanzania, indicates good conditions for investors, which can attract more capital and support bank expansion.

Figure 4.1: Renewable Energy Consumption in Africa Countries


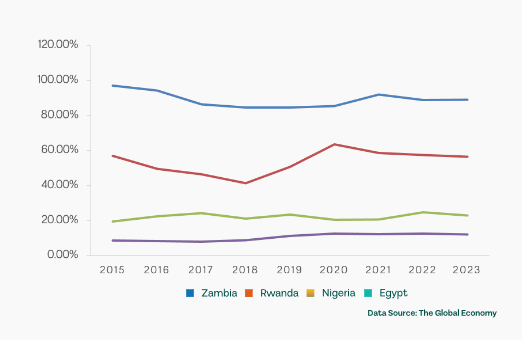
East and North Africa currently attract the most diversified FDI. Egypt in North Africa has a total sum of $118 billion from 2015 to 2024. It is important to note that each country in Africa had a downturn in 2020 due to the pandemic. While Egypt has the highest sum and Kenya has the lowest, the common drivers of foreign direct investments in these Countries like Zambia are above the global average in renewable energy production and consumption, above 85% in total consumption is coming from clean energy. Rwanda, Nigeria, and Egypt have lower levels and a  decline from 2015 to 2023. The major source of renewable energy in Zambia, Rwanda, and Nigeria is hydropower. Solar energy is also emerging in these countries. Egypt’s major source of renewable energy is  solar energy. There’s a need for heavy investment in clean energy to promote climate awareness across the entire continent.

Finance and Health indicators (Capital formation and life expectancy)

ESG awareness among African financial institutions is rising. Many banks are beginning to adopt social-and-
environmental (E&S) principles, hire ESG staff, and attempt to integrate social risk management into credit, lending, and project-finance policies, especially in institutions based in South Africa and Kenya. They create funding for projects with explicit social goals: community development, social infrastructure, inclusive finance, climate-resilient livelihoods, etc. Research confirms that governance quality (i.e., good governance) is strongly correlated with better social, environmental, and economic development outcomes.

Health and education investment was once donor-led and limited in scale. Since COVID-19, health is seen as a security and economic priority, with growth in pharmaceuticals, diagnostics, health-tech, and local manufacturing. Education investment is shifting toward ed-tech, skills development, and vocational training aligned with labour markets. With limited public funding, blended finance and public-private partnerships are increasingly used. Both sectors are now recognized as core investments in productivity and long-term growth.

There has been a -16% reduction in return on assets in Nigeria, Ethiopia -75% from 2015 to 2021, while there have been 10% and 40% increment in Ghana and Tanzania, respectively, during the same duration. These suggest many African banks remain fairly profitable despite macroeconomic headwinds. High return on assets, especially in countries like Ghana and Tanzania, indicates good conditions for investors, which can attract more capital and support bank expansion.


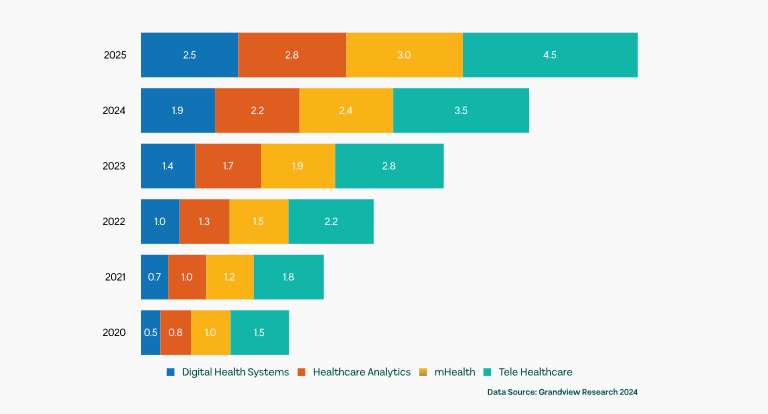
Figure 4.2: Africa Digital Health Market Size by Technology, 2020-2030 ($ Billion)


For example, coal is mostly the primary source of cooking in most countries in Africa. And coal is known to have health risks, such as lung diseases and indoor/outdoor air pollution. Using the recent investments in cooking gas by Africa’s richest man, Aliko Dangote, backed by the government, to fully eradicate the use of coal for cooking, to a cleaner and safer technique, to improve the life expectancy of the citizens. A case in point is the liquefied petroleum gas in Nigeria.

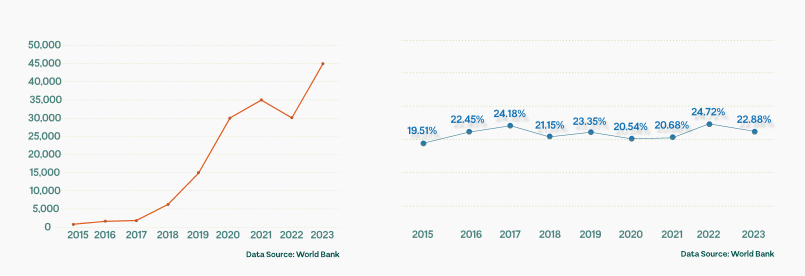
Figure 4.3: LPG Consumption in Nigeria in TeraJoules (TJ)
Figure 4.4: LPG Consumption in Nigeria


Nigeria has a 17% increment in the percentage of the population using cooking gas from 2015 to 2023. And has almost X50 consumption level from 2015 to 2023 (962 to 44,802). The data indicates Nigerians are slowly embracing a cleaner way of cooking. The strategic investments by Aliko Dangote, with the assistance of the government via clean energy policies and reforms, will help improve the standard of living and also increase the life expectancy rate among its citizens in the long run.


Governance, leadership, and institutional effectiveness

Institutional focus on ESG governance is rising. The 2024 ESG Forum by the African Development Bank aimed to promote ESG disclosure across Africa, recognizing governance and transparency as critical for sustainable development and investment flows. Better ESG governance and disclosure frameworks can attract international investors, especially as global capital increasingly seeks ESG-compliant assets. For African firms and banks, this could open access to more capital, lower borrowing costs, and improved credibility. In zones or countries with weak governance adoption, there is a risk of being sidelined from the growing sustainable-finance flows or facing a higher cost of capital due to ESG-related risk premiums.


Figure 4.5: Percentage of Renewable Energy Generation in African Countries


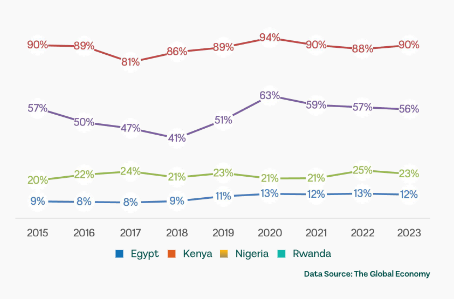
Governments in various countries are taking low-interest loans to increase renewable energy output. An example can be seen in Figure 31, where Egypt, Kenya, Nigeria, and Rwanda have seen fluctuation in renewable energy output, but we can’t deny the upward movement renewable energy had in these countries, which is a good sign. Governments across various countries in Africa are pushing policies to support green energy. Therefore, increasing the adoption of clean energy across various sectors in Africa. Kenya, for example, has massively adopted policies that promote clean energy, and it uses it to run the majority of the country, reducing pollution and heat emission from other sources of energy.


Are African governments fast enough to support growth?

Africa is at the beginning of a potentially transformational shift; ESG, once marginal, is becoming central to how finance, investment, policy, and development are framed on the continent. The combination of rising ESG-finance flows (sustainability bonds, green finance), growing institutional commitment (via AfDB, banks, regulators), and increasing global capital demand for ESG-compliant investments suggests substantial upside for sustainable development, environmental protection, and social inclusion. This means a shift toward truly sustainable, inclusive, resilient economies centres on building governance capacity, data and disclosure disclosure infrastructure, institutional transparency, and standardization of ESG frameworks. Without these, ESG finance risks are symbolic rather than substantive.

Regions with stronger institutional foundations (Southern Africa, parts of East and North Africa) are better positioned to lead the transition, but the greatest long-term risks lie in zones with environmental vulnerability, weak governance, and large rural populations (West & Central Africa’s fragile states). If ESG is not mainstreamed there, inequalities may widen, and vulnerabilities (climate, social, economic) may deepen.

FIT Fintech, Innovation, and Technology

Digital transformation and economic growth

Africa’s fintech and digital-technology ecosystem is entering a major era characterized by rapid mobile-money expansion, rising digital payments, emerging digital-credit models, and major advances in digital infrastructure. Yet progress is uneven, with regional strengths and systemic weaknesses shaping outcomes zone by zone. The more adults with financial accounts, the higher the level of financial transactions and volume, which in turn increases the level of total economic output.

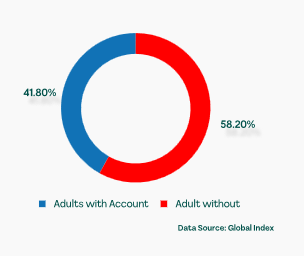
Figure 5.1: Adult with and without account in 2024


According to the 2025 Global Findex update, about 58.2% of adults (15+) in Sub-Sahara Africa had a financial account (bank or mobile-money/digitally enabled) in 2024, up from 49.3% in 2021.

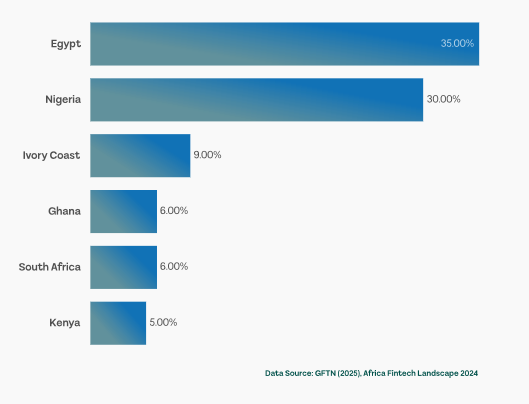
Figure 5.2: Share of Fintech Funding by Country 2024 (%)


Fintech in Africa has moved beyond experimentation. The number of firms grew from about 570 in 2020 to over 1,000 by 2024, signalling a mature sector. In 2024, Kenya raised $638 million in fintech funding, while Nigeria raised about $400 million, showing clear regional hubs according to Partech 2024.


Figure 5.3: Regional Share of Africa’s Funding Market, 2024 (%)


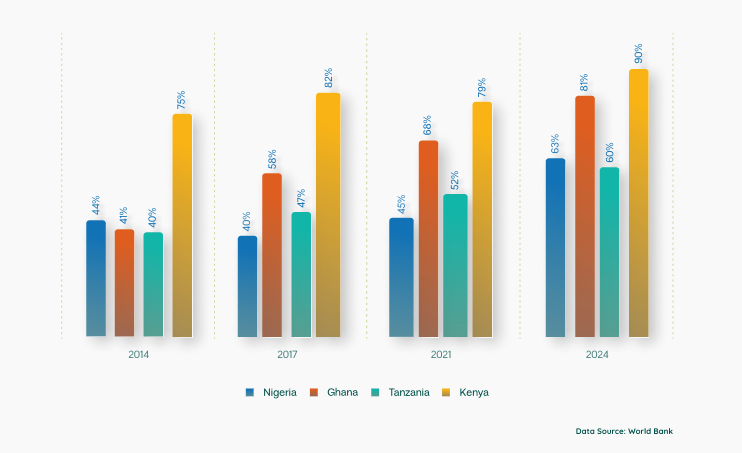
Historically, East and West Africa have been the pioneers of mobile-money-led inclusion (with countries like Kenya, Tanzania, Uganda) (see figure 34). The early arrival of mobile-money infrastructure there laid the foundation for high financial-account penetration through digital channels, especially in countries with supportive regulatory reforms.

Figure 5.4: Account Ownership with Banks or Mobile Money Providers in East and West African Countries


All of these countries (Nigeria, Ghana, Tanzania, and Kenya) have had an increase in account ownership, which indicates signs of improvements in financial inclusion (see Figure 35). Other zones (Central, Southern, and North Africa) have shown moderate account penetration; in many economies, traditional banks co-exist with growing digital financial services, indicating a hybrid model (bank + fintech). This means mobile-money and digital accounts are no longer marginal; they are central to expanding formal financial inclusion in Africa. Financial inclusion is expanding fastest where mobile-money infrastructure was early or where regulatory/market conditions allowed fintech/mobile-money growth. Thus, East and many West African economies are leading.


Digital Payments & Mobile-Money Usage

Digital transactions in emerging and developing economies (including SSA) surged sharply. According to the latest IMF Financial Access Survey, digital transactions per adult increased from 55 per adult in 2017 to 251 per adult in 2024. Mobile-money is now not just for remittances or P2P transfers but also for savings, bill payments, merchant payments, and small business transactions. The shift to digital payments is contributing to the broader formalization of financial flows, even among previously informal or cash-reliant segments.

In East and West Africa, mobile-money system users increasingly rely on digital payments for everyday transactions (P2P, merchant payments, bill payments, small business transactions). The high mobile penetration supports frequent digital usage. The other zone is also making headway in digital payments through traditional banking, but the low level of reliance on mobile money puts them behind East and West. In Central, Southern, and North Africa, banks remain dominant for higher-value transactions; however, wallets and e-money are gaining traction for smaller payments, remittances, and informal sector transactions. Digital payments, especially via mobile money, are transforming how Africans transact, offering more convenience, lower cost, greater inclusion, and financial transparency. The growth of digital payments lays the groundwork for more advanced financial services (credit, savings, micro-enterprise financing) because transaction history and digital footprints create traceable records, improve tax compliance, and enable better financial planning.


Fintech ecosystems and financial inclusion

While digital transactions have increased dramatically across developing economies, with emerging fintech credit services growing in parallel. Mobile-money accounts are not only used for savings and bill payments, but they are also used for lending: some countries report substantial proportions of formal borrowers using mobile-money providers rather than traditional banks due to their easy user interface and low entry barrier. Fintech growth is especially strong in the largest economies in Africa (e.g., Nigeria, Kenya, South Africa, Egypt). East and West Africa continue to lead in fintech-driven credit models as mobile-money credit (microlending) and savings-based credit have scaled substantially. Fintech-financed credit and savings are growing alongside traditional banking; forms like digital micro-finance, Neobanks, and digital savings platforms are gaining adoption in Central, Southern, and North Africa.


Figure 5.5: Total Sum of FDI in Some Easy and North African Countries From 2015 to 2024 (N Billion $)


While Egypt has the highest FDI inflows and Kenya has the lowest, the common drivers of foreign direct investments in these countries are public infrastructure investments (often state-led), value chain investments, and clean power/energy investments. Stronger FDI inflows lower the cost of capital, create employment, and support technology transfer. Meanwhile, weak foreign direct investment, especially in Central Africa, reflects continued governance and regulatory risks. Fintech credit and digital finance are expanding the reach of credit and financial services,especially to underserved, unbanked populations, enabling small businesses, micro-entrepreneurs, and individuals to access credit, save, and transact. This can fuel economic activity, entrepreneurship, and investment at grassroots and SME levels, which traditional banking might not reach due to high costs or risk aversion.


Innovation, start-ups, and technology hubs

Mobile-phone ownership and smartphone penetration have expanded dramatically, underpinning the reach of fintech and digital finance. According to the 2025 Digital Connectivity Tracker, a large share of adults in low- and middle-income economies own mobile phones. The fintech ecosystem across Africa has matured: more fintech start-ups, growing investment in fintech, wider agent networks for mobile-money, and increasing digital-finance infrastructure deployment (wallets, payment rails, data centres) in key economies.


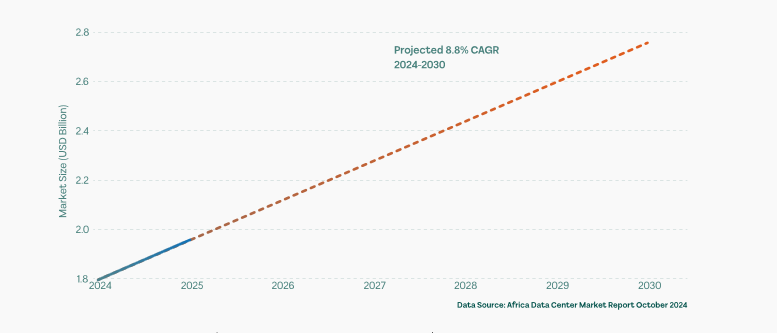
Figure 5.5: Africa Data Center Market Size ($Billion), 2024-2030 Forcast


Rising infrastructure investments, growing fintech presence in countries like Nigeria, Ghana, Côte d’Ivoire; means the growth of fintech in Africa is built on data integration as mobile money is now be used as a mode of payment, credit facilitation, insurance, etc., As figure 37 shows increase in consumer data will also lead to increasing venture financing, fintech start-ups, and mobile-money operators. This is building a strong foundation for digital-finance infrastructure in West African countries. High mobile penetration, robust fintech ecosystems (P2P payments, digital credit, micro-insurance, agent networks), and growing innovation capacity in the East. More stable internet and telecom infrastructure; digital literacy and regulatory standards are relatively advanced in the South, while Infrastructure remains a bottleneck — lower mobile/internet penetration, limited fintech provider presence, poor agent networks outside urban centres, as Innovation capacity remains low in Central and most North Africa countries. But there is growing interest in digital banking, e-payment systems, and fintech start-ups, particularly in urban areas. Digital infrastructure (mobile networks, internet, smartphone penetration) is the backbone for fintech adoption. Regions with strong infrastructure stand to gain the most from fintech-led financial inclusion and digital finance. Where infrastructure lags, growth of fintech and financial inclusion may be constrained, leading to persistent disparities. As fintech ecosystems mature, innovations beyond payments, such as digital credit, savings, micro-insurance, and data-driven financial services, become feasible, deepening financial intermediation.


Strategic frameworks and digital trust

From a strategic-development and investment perspective, the trends above suggest the following. Financing Ecosystem Deepening as digital account ownership and payments rise, pools of domestic savings are likely to grow. This creates raw material for investment, credit, and financial intermediation — potentially reducing reliance on foreign capital. Small and medium-sized enterprises’ growth & entrepreneurship in Fintech-based credit and digital payments lower entry barriers for small businesses and micro-entrepreneurs, particularly in underserved or rural areas. This could democratize entrepreneurship, support economic diversification, and promote regional financial integration with the expansion of mobile money and fintech across the zone.

With rising cross-border trade and remittances, there is an opportunity for pan-African payment rails and interoperable fintech infrastructure linking economies like MTN Momo, easing remittances, and fostering regional trade. Risk & regulatory challenges in rapid fintech growth must be matched with regulatory frameworks, consumer protection, data privacy, digital-literacy initiatives, and infrastructure investment. Otherwise, risks of exclusion, fraud, over-indebtedness, and inequality may rise.


Is technology translating into productivity and inclusion gains?

After more than a decade of mobile-money pioneering and incremental fintech growth, Africa is entering a phase of maturation and structural transformation in financial services. In zones with strong fintech ecosystems, financial inclusion is transitioning from basic account ownership to comprehensive digital financial services like payments, savings, credit, micro-finance, and digital banking. Digital payments and mobile-money adoption are becoming the norm for everyday transactions, savings, and remittances, especially among previously unbanked populations. Fintech is emerging as a viable alternative (or complement) to traditional banking, particularly in serving SMEs, informal sectors, rural populations, and younger demographics.

JET-Jobs, Economy, and Trade

Employment trends and labour market challenges

Jobs, economy, and trade are key sectors in every country in the world; no country would be able to survive without them. In Africa, jobs and trade have been the backbone of the continent’s survival, as each country depends on the others for goods and services it specializes in. In 2020, the world economy was put on hold, people were told to go home and isolate themselves and their households to prevent the spread of Corona virus. The impact of these not only affected the working class and business people, but it also affected the entire economic activity as borders were shut down and rendered services, goods in transit that were supposed to ease the needs of the people were also held for safety concerns. People in idleness, alongside other factors, contributed to the violence outbreak in various countries across the continent, like the ENDSARS movement in Nigeria. The Covid-19 was glaring evidence to us (households, businesses, and the government) that the economy in various countries across Africa cannot survive without jobs and trade, as many are gainfully employed in the informal sector and living on daily incomes.

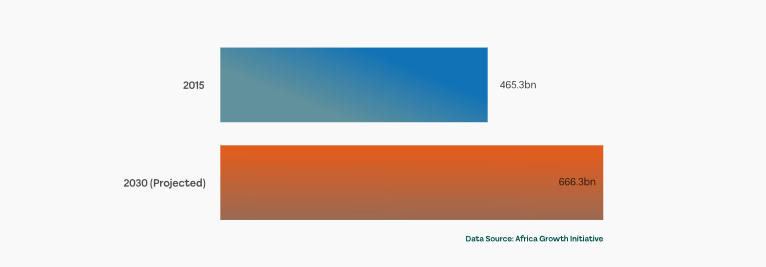
Africa’s manufacturing sector was stagnant five years ago, constrained by high energy costs and weak logistics. Today, import pressures, supply-chain re-shoring, and AfCFTA are reviving interest in regional manufacturing hubs. Food processing, pharmaceuticals, building materials, textiles, and light assembly are seeing increased investment. Manufacturing’s main value lies in job creation, with business-to-business spending projected to reach $666.3 billion by 2030, up $201 billion from 2015.

Figure 6.1: Projected Growth in Africa Manufacturing Business to Business Spending, 2015-2030 ($ Billion)


Youth employment and skills mismatch

According to the most recent edition of the World Bank’s Africa’s Pulse (October 2025), sub-Saharan Africa all (SSA) is projected to grow at 3.8% in 2025, rising to 4.4% annually in 2026–27 under baseline assumptions of  all things being equal, the working-age population is set to expand by over 600 million people by 2050; “only  about 24% of new workers today are engaged in wage-paying jobs.” This indicates that the job is and will be a challenge to various people across the continent as the workforce continues to outgrow the number of jobs available across sub-Saharan Africa. Most new jobs in SSA are low-productivity and in unstable industries, meaning many jobs do not translate into stable income growth or poverty reduction.

What this means: Economic growth alone does not translate into stable employment at scale; the structure of employment remains twisted toward casual, low-productivity jobs. Given the rapid demographic expansion of large young labour-force applicants and the inability to create sufficient quality jobs, unemployment, underemployment, poverty, and social stress. GDP growth might suggest structural transformation in the economy, but it does not necessarily mean job creation, as various factors like capital formation, low interest rate, exchange rate, inflation, and even external factors can drive GDP growth.

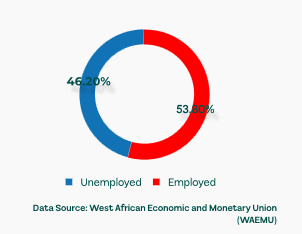
Figure 6.2: Employment Rate in West Africa in Q4


According to a 2025 report on labour markets in the region, the employment rate in the West African Economic and Monetary Union (WAEMU) rose to 53.8% in Q4 2024, from 51.3% in the previous quarter; unemployment reportedly fell to about 11.6%. Nevertheless, the region remains heavily informal. With limited “skilled labour” and a shortage of medium-sized firms capable of providing stable wage employment.


Economic diversification and industrialisation

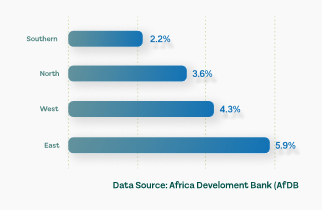
According to the Africa Development Bank (AFDB), Africa’s overall economy is projected to grow by 3.9% in 2025, reaching around 4.0% in 2026. The pace of growth varies significantly by region: AfDB projects East Africa leading with about 5.9% growth in 2025–26; West Africa about 4.3%, North Africa around 3.6%, and  Southern Africa much slower, 2.2% in 2025 (see Figure 6.3).

Figure 6.3: Projected Growth Rate in Africa by Zone


According to the Africa Development Bank (AFDB), Africa’s overall  economy is projected to grow by 3.9% in 2025, reaching around 4.0% in 2026. The pace of growth varies significantly by region: AfDB projects East Africa leading with about 5.9% growth in 2025–26; West Africa about 4.3%, North Africa around 3.6%, and Southern Africa much slower, 2.2% in 2025 (see Figure 40).

This indicates that though growth continues, persistent structural issues (informality, low productivity, insufficient firm growth) undermine the capacity of growth to generate broad-based welfare improvements.

The diverse growth performance suggests a multi-speed Africa: some sub-regions (East, parts of West) may harness growth more effectively; others (Southern, North) might lag. Modest per-capita GDP growth indicates that aggregate growth does not automatically translate into substantial gains in living standards, especially if population growth remains high and employment remains informal. Growth concentrated in certain sectors (natural resources, extractives, commodity exports) may generate GDP growth without corresponding broad-based economic transformation or employment gains.


Intra-African trade and AfCFTA implementation

Intra-African investment remains modest but is growing steadily. Trade reached $190billion in 2023, with its share rising to 14.9%. Most regional investment is in services, while extractives still dominate external investment. South Africa, Kenya, and Nigeria lead regional flows. AfCFTA is reducing barriers and improving market access, though currency controls, regulatory differences, and high logistics costs still limit integration.

Figure 6.4: Intra-African Trade Volume and Share of Total African Trade (2020-2024)


Global trade tensions, tariff uncertainty, and the global economic slowdown continue persist; many African economies remain resilient, with a subset of 21 countries still expected to grow by more than 5% in 2025. However, the AfDB notes that slower global demand and policy uncertainty could negatively affect trade — imports and exports, which may weigh on countries dependent on commodity exports or global supply chains. Intra-African foreign direct investment is concentrated in services, including finance, telecommunications, business services, and tourism. Extra-African investment continues to focus on extractive industries. South Africa, Kenya, and Nigeria are the largest sources of regional investment. Despite this growth, intra-African investment remains small, contributing roughly 5% of employment creation and less than 3% of total capital deployed. This research has proven that deeper economic integration, better institutional quality, infrastructure, and human-capital investments are strongly associated with increased intra-African trade and structural economic transformation. For many African countries, trade and structural diversification remain critical levers for sustainable growth and employment: moving beyond commodity/export-led growth toward value-added manufacturing, agro-processing, services, and trade integration (both intra-African and global). Overdependence on commodity exports (oil, minerals, raw agriculture) remains risky as global price swings, trade disruptions, and external demand shocks can quickly reverse growth gains. Only integration (through regional trade agreements, improved infrastructure, and institutional reform) can unlock economies of scale, link SMEs to regional value-chains, enhance foreign direct investment (FDI), and catalyse structural change.


Zone Trade and Structural Dynamics

The West and Central Africa region has the demographic base and natural-resource potential to benefit significantly from trade-led growth and structural transformation. If policy supports diversification, value-addition in agriculture and natural resources, and trade integration (intra-regional and global), there is a potential for structural transformation away from subsistence agriculture and informality. But fragility, political instability, weak infrastructure, and institutional weaknesses remain constraints. East Africa, with robust growth and improving macroeconomic stability, stands out as a candidate for expanding manufacturing, services, and regional export-oriented production. As regional trade integration (e.g., via regional economic communities) deepens and infrastructure improves, East Africa could become a hub for regional value chains, leveraging the demographic dividend and rising domestic demand. Southern Africa region’s heavy reliance on extractive/commodity sectors and exposure to global commodity price volatility make diversification urgent. Success depends on investing in manufacturing (e.g., value-added agriculture, agro-processing), infrastructure, and trade facilitation, but structural rigidities and economic headwinds pose challenges. North African economies often more industrialized and connected globally, have a comparative advantage in trade and structural transformation. With stable institutions, proximity to Europe and the Middle East, and relatively diversified economies, the region can leverage trade, manufacturing, tourism, and services to sustain growth and job creation.

Emerging Patterns: Growth without transformation across many zones, GDP growth persists, but structural transformation and quality job creation lag — a classic “jobs-poor growth” scenario. Informality remains pervasive with evidence indicating that a majority of jobs in SSA remain informal, low-productivity, and subsistence-based — limiting income growth, social protection, and firm development. Divergent regional trajectories in some zones (East Africa, parts of West Africa) show potential for structural transformation; others (Central/fragile states, resource-dependent economies) risk stagnation or decline. Need for medium & large firms, as highlighted by the World Bank, shifting growth models toward medium/large firms is key to generating wage employment at scale. Trade & diversification as critical levers for sustainable growth, countries must pivot away from raw-commodity exports and toward value-added industry, regional value chains, trade integration, and diversified economies.


Is growth generating enough quality jobs and trade opportunities?

From a vantage point of a decade observing African economies, the following scenario seems likely over the next 5–10 years if the right policies are implemented. Africa will continue to grow, but much of that growth will remain jobs-poor unless structural transformation accelerates. A few zones (notably East Africa and parts of West Africa) may successfully transition toward diversified, export-oriented, value-added economies with growing formal employment, stronger manufacturing or service sectors, and expanding middle-class incomes. Many countries/regions may remain stuck in a cycle of informality, low productivity, and vulnerability to commodity cycles or global shocks, especially those dependent on extractive industries or lacking institutional capacity. Trade and regional integration If advanced, will be a major driver of structural transformation, enabling economies of scale, cross-border value-chains, and more stable economic growth. The demographic dividend (youth bulge) will remain both an opportunity and a risk. With effective investment in human capital and economic diversification, it can drive growth; without it, it may exacerbate unemployment, poverty, and instability.

In short, Africa stands at a crossroads. Resilient growth continues, but turning growth into broad-based prosperity, jobs, and structural transformation will require bold policy, institutional reforms, investment, and strategic diversification.

PIE-Power, Infrastructure, and Energy

Africa stands at an essential point in its energy and infrastructure evolution. Once defined by long-lasting electricity deficits and heavy reliance on traditional biomass, the continent is now undergoing a gradual transformation shaped by economic growth, demographic expansion, technology advances, and global decarbonization pressures. Energy is central to this shift, not only as a catalyst for industrialization and development but also as a foundation for sustainable growth. This analysis explores the state of power, infrastructure, and energy in African countries using key metrics like renewable energy investments, access rate, power generation and consumption trends, energy use per capita, liquefied petroleum gas (LPG) adoption, and infrastructure development index.

Africa’s renewable energy sector is growing rapidly. Investment rose from about $2.6 billion in 2021 to an estimated $40 billion in 2024, the fastest growth period on record. Despite this progress, Africa still receives less than 3% of global clean-energy investment, even though it accounts for nearly 20% of the world’s population and has vast renewable resources. To reach its target of 300 GW of renewable capacity by 2030, Africa needs around $100 billion per year. Current investment leaves an annual gap of about $60 billion, showing that recent gains, while historic, are not yet sufficient.


Figure 7.1: Energy Investment Per Capital: Africa Vs World ($)


Technology Mix and Gaps

In 2024, renewable investment was heavily concentrated in solar power, which made up 62% of total investment. Wind accounted for 16%, while bioenergy and small hydropower made up the rest. Solar’s dominance reflects its low cost and fast deployment, but limited diversification weakens grid stability and underuses Africa’s wind, hydro, and geothermal potential.
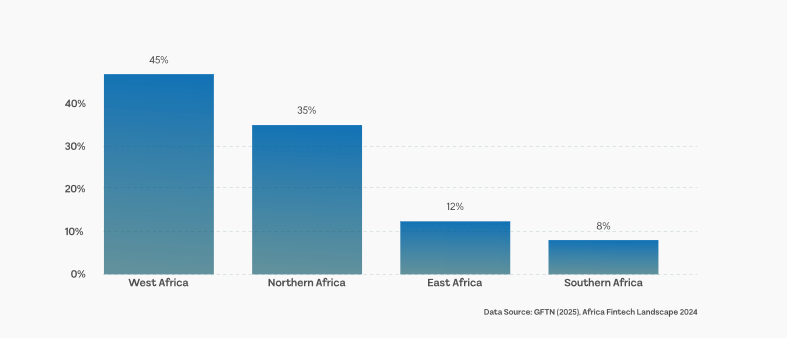
Figure 7.2: Africa’s 2024 Clean Energy Investments


Private Capital and Financing Models

Private investors are playing a growing role. By 2025, private renewable investment is expected to reach $900 million, mainly in pay-as-you-go solar, mini-grids, and embedded generation. These projects are smaller than utility-scale plants but are critical for expanding access in underserved areas. Overall, the private sector provides about 75% of total energy investment, supported by risk-sharing and blended-finance tools from development finance institutions, which help reduce risk and attract capital.
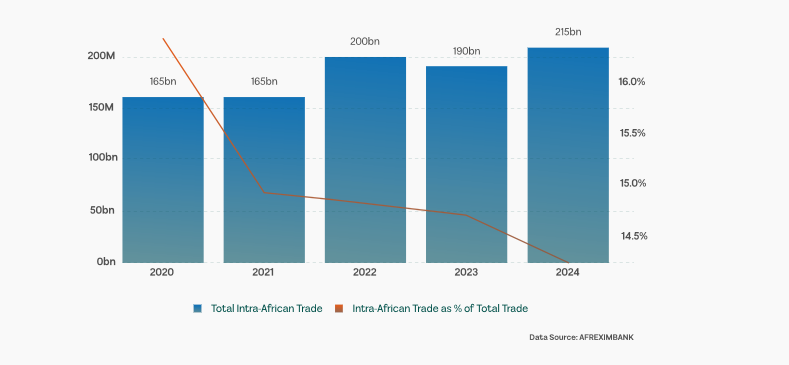
Figure 7.3: Energy Investment in Africa by Finance Provider, 2019-2024 ($ Billion)


Access rate and energy availability represent the percentage of the population with access to electricity. A high access rate indicates widespread electricity coverage, critical for economic development and quality of life. As of the early 2020s, almost 43% of the population in African have access to electricity.


Figure 7.4: Electricity Access Rate In Africa, 2019-2023 (% Of Population)


However, the access rate has improved significantly over the past decade, especially in North African countries like Egypt, Morocco, and Algeria, achieving 100% of both urban and rural areas from the previous range of 90% in 2015.

Figure 7.5: Electricity Access Rate In West Africa Countries (%)


Looking at the chart above, North African countries like Egypt, Morocco, and Algeria have all had an upward trend in the electricity broadband coverage, including both urban and rural areas of their respective country. While certain region has been outstanding, there are other regions still struggling to give their citizens the desired level of access to electricity in both rural and urban areas, like West African countries.

Access rate and energy availability represent the percentage of the population with access to electricity. A high access rate indicates widespread electricity coverage, critical for economic development and quality of life. As of the early 2020s, almost 43% of the population in African have access to electricity.


Figure 7.6: Electricity Access Rate In West Africa Countries (%)


These three countries have improved their electricity access rate from what it was in 2015 to 2023, but you can see they were not even close to the North African countries, and that is due to the infrastructure gap in power generation, distribution, and transmission.

Africa’s total power generation capacity exceeded 256 gigawatts in 2023, according to the International Renewable Energy Agency (IRENA), less than 3% of the world’s total output. With countries like South Africa, Nigeria, Egypt, and Algeria accounting for the majority majority of the total generation on the continent, creating a highly uneven energy landscape.

Figure 7.7: Power Generation In South Africa, Nigeria, Egypt, And Algeria 2015, 2019 vs 2023 (GWh)


Algeria has increased its power generation by 41% from 2015 to 2023, Nigeria 28%, Egypt 12%, and South Africa has seen a -10% decline during the same time frame, respectively. While South Africa has experience decline in its output level despite being ahead of the rest. These countries have different sources of electricity generation. Algeria (natural gas), Nigeria (natural gas and hydropower), Egypt (natural gas), and South Africa (coal). Renewable energy is growing rapidly, especially solar energy, hydropower, and geothermal, which signals a gradual but meaningful transition towards clean energy systems.

Power consumption, on the other hand, has been below the level of generation in these countries because the 4 countries don’t just see power as a source to light up their economy but also as a source of income by exporting the excess to neighbouring countries around them.

Figure 7.8: Power Consumption In South Africa, Nigeria, Egypt, And Algeria 2015, 2019 vs 2023 (GWh)


Algeria has seen a 49% increment in power consumption (compared to it 41% generation increment) from 2015 to 2023, Egypt 4% increment (compared to 12% generation increment), Nigeria 22% increment (compared to 28% generation increment) and South Africa -12% decline (compared to 10% generation decline) during the same time frame. Only Algeria is consuming more power than it can produce, and it’s just a matter of time before it encounters a deficit if its generation capacity is not massively improved. The per capita electricity consumption in Africa remains extremely low (550 KWh) per person annually, compared to the global average of over 3,000 KWh. This indicates vast room for growth.

Despite improvements, Africa’s energy use per capita remains the lowest in the world, averaging 0.6 toe (tonnes of oil equivalent) per person, compared to the global average of 1.9 toe. Industrial and transport sectors absorb the largest share, while household depends on biomass (a major source of indoor air pollution and environmental degradation) in Africa.

Figure 7.9: Energy Use Per Capita (Kg In Oil) In South Africa, Nigeria, Egypt, And Algeria 2015 to 2022

The level of energy per capita in South Africa is much higher than in other countries, but has seen a decline in use per capita from 2015 to 2022. Nigeria, Algeria, and Egypt have an increase in energy use per capita from 2015 to 2022. Growing urbanization and the expansion of middle-class consumers are increasing energy demand, creating both challenges and opportunities for efficiency and clean technology adoption. Energy efficiency policies are gaining traction through regional programs led by the African Union and development partners.

Liquefied petroleum gas adoption is a critical component of Africa’s clean cooking transition. Traditional biomass (wood, charcoal, crop waste) still supplies about 45% of total primary energy, affecting health and forests. Liquefied petroleum gas use has grown steadily, especially in Nigeria, Ghana, Kenya, and Senegal, supported by subsidies reforms and distribution network investments.

Figure 7.10: LPG Consumption In Nigeria, Ghana, Kenya, And Senegal In Terajoules (TJ)


We can see from the chart above that the use of LPG over time from these countries has grown, especially in Nigeria, almost X50 from 2015 to 2023 (962 to 44,802). The average LPG consumption per capita in these countries is 4kg per year, while the global average is 15kg.


Infrastructure financing

The infrastructure development index measures the quality and availability of transport, energy, ICT, and water infrastructure. It shows that energy infrastructure remains a bottleneck for most African countries.

According to the Africa Development Bank (AFDB), Africa needs to invest $130-$170 billion annually in infrastructure, with an energy sector financing gap of over $40 billion per year.

The data below captures the infrastructure index in various countries, categorizing them by region.

Figure 7.11: Infrastructure Development Index In Southern Africa Countries (%)

South Africa leads the index, showing the level of investment put in place by the government to ease the lives of citizens and enhance overall development across each sector. Botswana, Namibia, and Zambia are also improving from where they were in 2015, but they are below average, which means the governments in each country have to dedicate a larger percentage of their GDP to improve their infrastructure.


Figure 7.12: Infrastructure Development Index In Southern Africa Countries (%)


Egypt is always setting an example for other African countries in North Africa when it comes to power, infrastructure, and energy. North African countries are relatively better than the Southern African countries used in this report. Algeria been above average shows the level of commitment in the region to improve infrastructure.


Enabling infrastructure for growth and competitiveness

The direction of change across Africa’s energy landscape is clear. Decentralization, mini-grids, and solar home systems are extending access faster than traditional grid expansion. Diversification, the energy mix is becoming more varied, reducing dependence on coal and oil across the continent. Digitalization using smart meters, mobile payments, and data-driven systems is transforming energy management. Regional integration by power pooling and infrastructure guides is linking markets and improving efficiency. Sustainability by ensuring climate commitments and green finance are steering investments towards renewables and energy efficiency.

Strengthening Energy Data Systems and Statistics: The African Energy Commission (AFREC) has for years developed the African Energy Information System (AEIS), a continental-level data platform and decision-support tool. A large database system that collates data on energy balances, hydropower, biomass, and more. These systems have helped improve governance, capacity, and quality of the national energy information system. It also runs trainings for national energy stakeholders in various countries, such as South Africa. Better data infrastructure means more accuracy in energy systems. There have also been collaborations, IEA and AFREC. IEA (International Energy Agency) is working with AFREC to help countries assess data gaps.
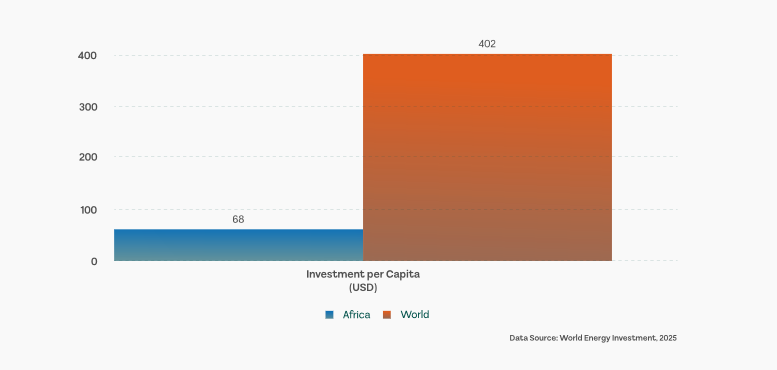
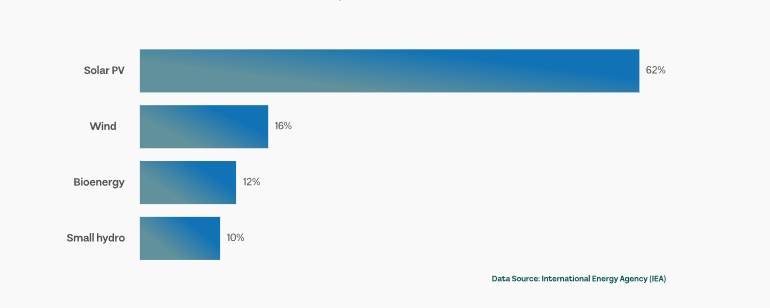
National Energy Compacts (Mission 300): 12 countries presented National Energy Compacts at the 2025 Mission 300 Africa Energy Summit. These compacts are national level policies where governments set concrete targets and policy measures for:

  • Expanding energy infrastructure
  • Regional power integration
  • Distributed renewable and clean cooking
  • Private sector participation, and
  • Strengthening utilities

Just Energy Transition Partnerships (JETPs): Several African countries, like South Africa and Senegal, have signed to become development partners on energy. The South African government under JETP has negotiated policy-based financing to support a shift away from coal, with social protections, job transition, data integration, and infrastructure modernization. Senegal JETP reforms support renewable deployment and universal access. With the targets of raising the renewable share to 40% by 2030. JETPs in various countries generally come with monitoring, reporting, and verification frameworks. To meet their commitments by producing reliable data on emissions, generation mix, capacity deployment, and social outcomes to enable transparency for international financiers.

Kenya/Regional Integration: Kenya’s policy moves in East Africa; it recently conducted a trial to transmit electricity from Ethiopia to Tanzania, signaling deeper regional integration. The cross-border trading requires low costs and reliability, meaning infrastructure policy is pushing towards a more data-intensive system that requires capital and financing. Showing it is both a policy and a capital project, as both are two sides of a coin (power and energy).

Conclusion – AFRICA GROW: From Potential To Performance

Africa stands at a decisive inflection point. The continent’s growth fundamentals—demographics, resource endowment, expanding markets, and accelerating digital adoption—remain strong. However, the evidence across the Africa Grow pillars confirms that growth outcomes remain uneven, fragile, and insufficiently transformative. The challenge is no longer one of opportunity identification, but of execution, coordination, and scale.

This conclusion synthesizes performance across the six pillars, identifies the key accelerators and binding constraints, and sets out priority actions to unlock Africa’s next phase of sustainable, inclusive growth.

Summary Scorecard Across the Six Pillars

Agriculture & Food Systems — Moderate Performance, High Risk

Agriculture remains central to employment and food security, yet productivity is structurally weak. Rising food insecurity, climate exposure, and inefficient input use offset gains from policy reforms and localized successes. Without productivity-led intensification, agriculture will continue to constrain both welfare and macroeconomic stability.


Banking, Investment & Capital — Strong Returns, Uneven Depth

African banking systems demonstrate resilience and profitability, with attractive returns on equity and improving asset quality in several regions. However, credit depth remains shallow, capital markets are underdeveloped, and inflation volatility continues to erode real returns and long-term investment planning.


Environmental, Social & Governance (ESG) — Emerging Strength, Uneven Readiness

ESG considerations are increasingly shaping capital flows into Africa, particularly in energy, infrastructure, and finance. Progress is evident in renewable energy uptake and financial inclusion, but weak governance, inconsistent disclosure, and limited institutional capacity risk exclude several countries from future ESG-aligned capital.


Fintech & Innovation — Strong Momentum, Structural Enabler

Fintech stands out as one of Africa’s strongest-performing pillars. Rapid growth in digital payments, mobile money, and digital credit has materially expanded financial inclusion and reduced transaction costs. Regulatory fragmentation and infrastructure gaps, however, limit scalability across borders.


Jobs, Economy & Trade — Growth Without Sufficient Jobs

Economic growth has resumed, but it remains insufficiently job-creating. Informality dominates labour markets, wage employment absorption is low, and structural transformation into higher-productivity sectors is incomplete. AfCFTA presents a major opportunity, but implementation remains uneven.


Power, Infrastructure & Energy — Foundational Constraint

Energy and infrastructure deficits remain the most binding constraints on growth. Electricity access, per capita power consumption, logistics infrastructure, and clean cooking solutions are behind global peers. Financing gaps and institutional bottlenecks continue to delay scale-up, despite strong demand and clear economic returns.


Key Accelerators And Binding Constraints

Key Accelerator:

  • Demographics and Urbanization: A young, growing population and expanding cities provide scale for consumption, labour, and innovation.
  • Digital Financial Infrastructure: Mobile money and fintech platforms are accelerating inclusion, domestic capital mobilization, and SME financing.
  • Regional Integration (AfCFTA): Offers scale, market diversification, and resilience against external shocks.
  • ESG-Al igned Capital: Growing global appetite for climate, infrastructure, and inclusion-linked investments.
    Policy Learning Effects: Successful reforms in agriculture inputs, banking supervision, and energy pricing demonstrate replicable models.


Binding Constraints

  • Low Productivity: Particularly in agriculture and informal services.
  • Infrastructure Deficits : Power, transport, and logistics constraints raise costs and suppress competitiveness.
  • Macroeconomic Volatility : Inflation, exchange-rate instability, and fiscal pressures undermine investment confidence.
  • Weak Institutions and Governance : Inconsistent policy execution and regulatory uncertainty.
  • Limited Job Creation Capacity : Growth remains capital-intensive or informal, failing to absorb new labour market entrants at scale.


Priority Actions For The Next Growth Phase

To translate potential into sustained performance, Africa’s next growth phase should focus on five priority action areas:

  1. Shift from Expansion to Productivity:
    -Prioritize agricultural intensification, value-chain development, and climate resilience.
    -Link input markets, finance, storage, and logistics to raise yields and stabilize food systems.
  2. Deepen Domestic Financial System:
    -Expand long-term credit, strengthen capital markets, and leverage fintech for SME and infrastructure financing.
    -Anchor macroeconomic stability to protect real returns and investor confidence.
  3. Scale Energy and Infrastructure Rapidly:
    -Accelerate power generation, transmission, and regional interconnection.
    -Close clean cooking and transport infrastructure gaps with blended finance and private-sector participation.
  4. Convert Growth into Job:
    -Target labour-intensive manufacturing, agribusiness, and tradable services.
    -Align education, skills, and industrial policy with private-sector demand.
  5. Institutionalize ESG and Regional Integration:
    -Standardize ESG disclosure and governance frameworks to unlock long-term capital.
    -Move AfCFTA from agreement to execution through logistics, customs, and regulatory harmonization.


Final Assessment
Africa’s growth story is no longer constrained by a lack of opportunity, capital interest, or innovation. The decisive variable is coordination across systems—finance, energy, technology, labour, and governance. The Africa Grow framework demonstrates that countries and regions that align these pillars consistently outperform peers.

The next decade will reward those economies that move fastest from fragmented progress to integrated execution. Africa’s challenge—and opportunity—is to make growth deeper, more productive, and decisively inclusive.

Partnership Brochure Download Form