Over the past decade, Africa’s investment performance shows a continent balancing global volatility while building stronger economic foundations. Returns have become more varied, with slowdowns during global tightening cycles offset by rebounds driven by reforms, higher commodity prices, and growing domestic demand. In 2025, African equity and fixed income markets outperformed many developed markets, supported by currency stability in key economies, better fiscal management, and strong performance in banking, telecommunications, energy, and materials.
Equities were the top-performing asset class, especially in frontier and reform-focused markets such as Ghana, Nigeria, and parts of East Africa, where rising valuations and earnings growth boosted returns. Hard-currency sovereign bonds also did well, benefiting from lower risk premiums after debt restructurings and improved macroeconomic management. Local-currency bonds underperformed in countries with currency declines, while real assets and infrastructure offered steady but smaller returns.
Looking ahead to 2026, Africa faces both risks and opportunities. Key risks include global monetary changes, trade disruptions, geopolitical uncertainty, and climate-related shocks. High U.S. interest rates affect capital flows and borrowing costs, while slower growth in China could hurt commodity exporters. Inflation swings, currency pressure, and high debt remain challenges for several countries.
At the same time, Africa offers strong opportunities for investors who understand its diversity. Markets with credible reforms, diversified exports, and strong domestic demand are better positioned to deliver good risk-adjusted returns. Investment strategies that combine selective equities, hard-currency bonds, and long-term allocations to infrastructure, renewable energy, and digital assets are likely to benefit from Africa’s demographic growth and ongoing economic transformation.
Africa occupies a unique spot in the global investment landscape, sitting between emerging and frontier markets. While it makes up just over 3 percent of the world’s GDP in nominal terms and nearly 7 percent in purchasing power parity, the continent is home to 18 percent of the global population and has the fastest-growing labor force in the world (IMF, 2025; UNDESA, 2024). This large and young population sets Africa apart from other frontier regions and underpins its long-term investment potential.
Compared with emerging Asia, Africa’s growth is more uneven and volatile, held back by infrastructure gaps and fiscal constraints. Still, it grows faster than advanced economies and Europe, and in some areas, it keeps pace with parts of Latin America in terms of reforms and resilient domestic demand. Unlike more mature emerging markets, African returns are less tied to global cycles, offering a valuable diversification benefit for global investors.
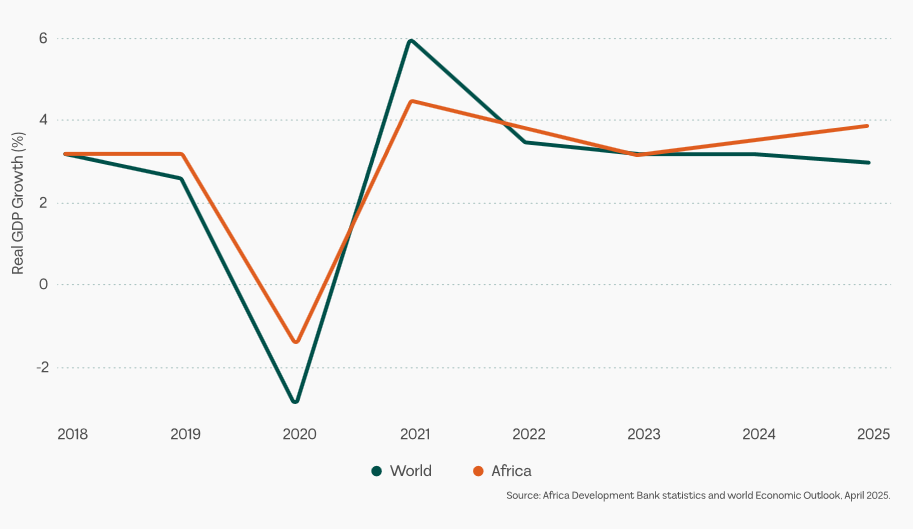
Real GDP: Africa vs World. 2018-2025
Shows real GDP growth trends for Africa compared to the world average from 2018 to 2025
Global Macroeconomic Conditions and Their Influence on Returns
Global economic conditions in 2025 have been highly volatile. World growth slowed to 2.8 percent, reflecting tighter financial conditions, renewed trade restrictions, and weaker cross-border investment flows (IMF, 2025). Elevated U.S. interest rates increased borrowing costs for African sovereigns and corporates, contributing to portfolio rebalancing away from riskier assets and tightening liquidity conditions.
Slower Chinese growth reduced demand for African commodities, particularly metals and energy, affecting export revenues and fiscal balances in resource-dependent economies. At the same time, global commodity price volatility created asymmetric effects: higher agricultural and fertilizer prices raised inflation and production costs, while declining energy and metal prices compressed revenues for oil- and mining-dependent states (AfDB, 2025).
Despite these headwinds, Africa’s projected GDP growth of 3.9 percent in 2025 and 4.0 percent in 2026 places the continent above the global average, reflecting resilience driven by consumption, infrastructure investment, and reform momentum (AfDB, 2025; IMF, 2025).
Capital Flows, Investor Sentiment, and Market Liquidity
Capital flows into Africa have become more selective rather than uniformly risk-averse. While official development assistance and concessional financing have declined, private capital is increasingly targeting renewable energy, digital infrastructure, agribusiness, and regional value chains. Equity and bond investors are differentiating more sharply across countries, rewarding those with credible reforms, transparent policy frameworks, and improving debt sustainability.
Investor sentiment remains sensitive to global shocks, particularly U.S. monetary policy and geopolitical tensions. Episodes of risk-off behavior continue to affect liquidity in African capital markets, especially in smaller exchanges and corporate bond markets. Nevertheless, deeper domestic investor bases and growing pension fund participation are gradually improving market resilience and reducing reliance on volatile foreign flows.
Currency Dynamics, Inflation,and Interest Rates
Currency volatility remains one of the most important drivers of African investment returns. In 2025, countries that achieved greater exchange rate flexibility and reserve accumulation experienced improved investor confidence and lower risk premiums. Conversely, economies facing persistent foreign exchange shortages or delayed reforms saw currency depreciation erode USD-denominated returns.
Inflationary pressures, largely driven by food prices, currency pass-through, and supply-side constraints, remain above target in many countries. Central banks have responded with tight monetary policies, though signs of stabilization in inflation and growth have allowed selective easing in reform-oriented economies. Interest rate differentials continue to shape carry trade opportunities, but currency risk remains a decisive factor for international investors.
Africa’s Positioning for 2026
Africa’s role in the global investment landscape is evolving from commodity dependence toward greater diversification and regional integration. The rollout of the African Continental Free Trade Area (AfCFTA), combined with demographic growth, urbanization, and technological adoption, is strengthening intra-African trade and domestic value creation.
While global uncertainty, geopolitical risks, and financial tightening remain constraints, Africa’s medium-term outlook is underpinned by structural reforms, expanding consumer markets, and growing investment in green and digital infrastructure. As a result, Africa is increasingly positioned not merely as a high-risk frontier, but as a differentiated growth region offering selective, risk-adjusted opportunities for long-term investors.
Africa Equities – Top 10 Listed Markets and Returns
Johannesburg Stock Exchange (JSE) – South Africa
Market scale and liquidity anchor Africa’s equity ecosystem
The Johannesburg Stock Exchange remains Africa’s largest and most developed equity market, with total market capitalisation exceeding US$1 trillion (World Bank, 2025). As the continent’s most liquid exchange, the JSE continues to serve as the principal entry point for international investors seeking African equity exposure. The market hosts a dense concentration of globally competitive mining groups, diversified financial institutions, and consumer-oriented multinationals, many of which derive a substantial share of earnings offshore. This structural depth and liquidity distinguish the JSE from other African exchanges and underpin its outsized weight in continental equity benchmarks.
Equity returns were strong, but currency effects diluted USD performance
South African equities delivered a strong rebound in 2025. The FTSE/JSE Capped SWIX Index rose 33.0% in local currency terms, reflecting improved risk sentiment and strong sectoral momentum. However, rand weakness reduced gains for offshore investors, bringing USD returns to approximately 20.5% (JSE, 2025).
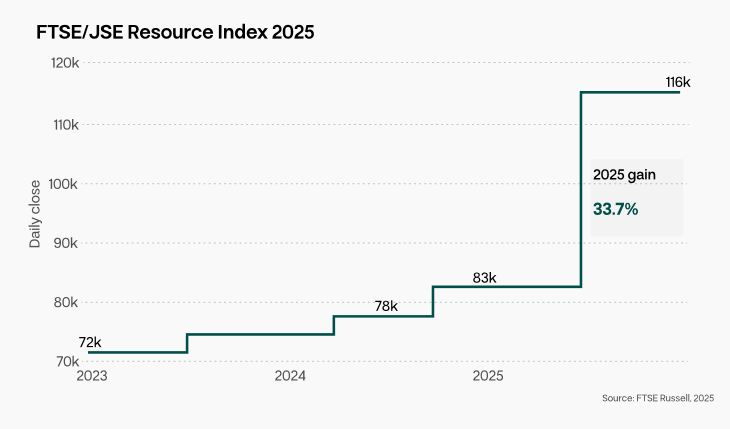
The impressive performance of the FTSE/JSE Resource Index
While these gains positioned the JSE among the stronger-performing large African markets, returns were lower than those of exchanges such as Ghana and Nigeria, where more stable local currencies and sharper valuation re-rating translated into significantly higher USD Returns.
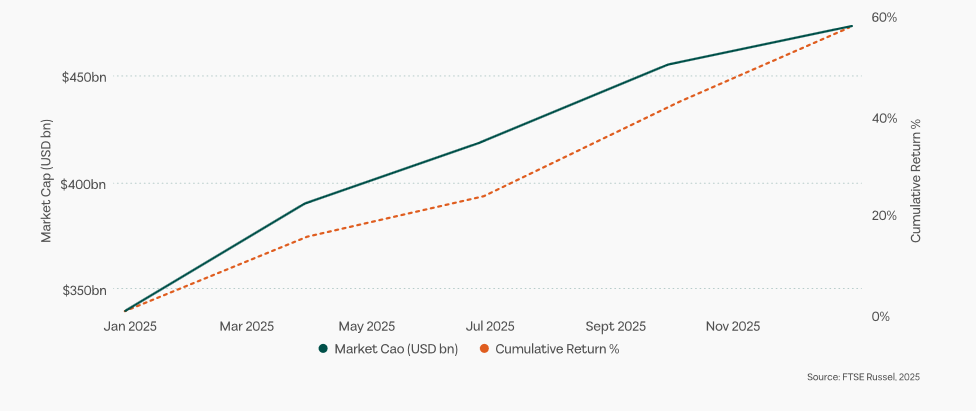
JSE All share index market capitalization growth.
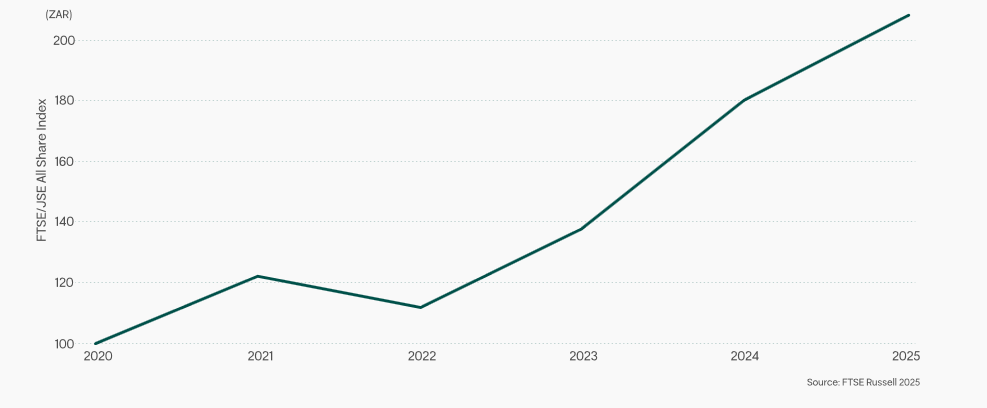
JSE All share index 5-year total return in local currency (ZAR)
Market depth remains exceptional by global standards
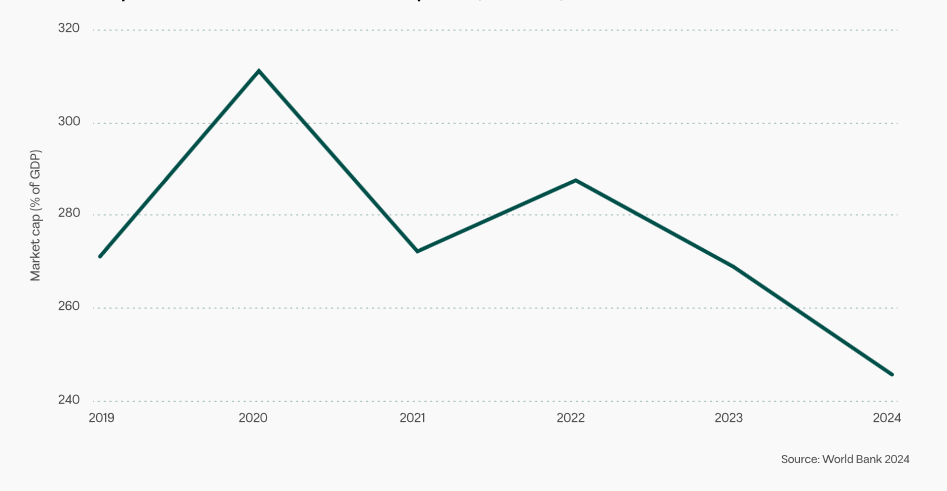
South Africa’s equity market continues to stand out in global comparisons of financial depth. JSE market capitalisation represented 246% of GDP (World Bank, 2024), placing it among the most market-intensive economies worldwide and far above most emerging and frontier peers (World Bank, 2023). This reflects not only the size of domestic firms, but also the global footprint of JSE-listed companies whose revenues and assets extend well beyond South Africa’s borders.
JSE Market Capitalization as % of GDP
Valuations expanded ahead of earnings breadth
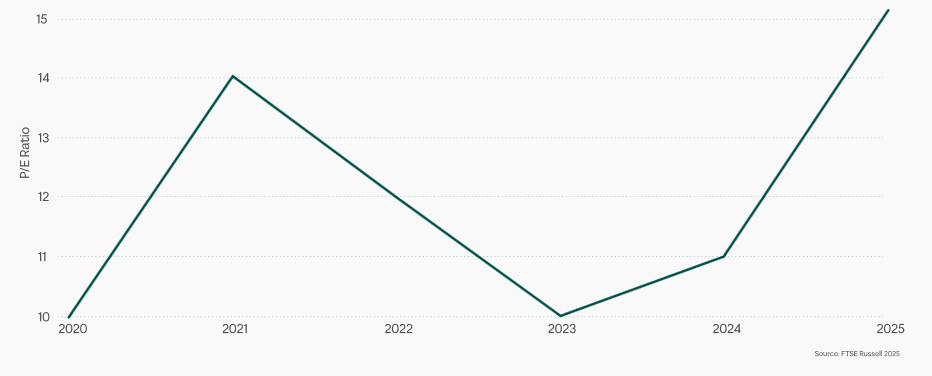
The 2025 rally was accompanied by a noticeable valuation expansion. The market traded at a forward P/E ratio of 14.3x, above its three-year average of 12.9x, indicating that price appreciation outpaced near-term earnings growth (Bloomberg, 2025). Dividend yields moderated to 2.0–2.5%, reflecting rising equity prices rather than declining payouts.
FTSE/JSE All Share Index: P/E Ratio Evolution 2020-2025
Earnings growth expectations were uneven. Projection of 34.2% annual earnings growth (RMB Morgan Stanley, 2025) for materials and mining stocks, domestic-focused sectors faced more subdued outlooks, constrained by weak credit growth and slow domestic demand recovery.
Sector leadership was narrow but powerful
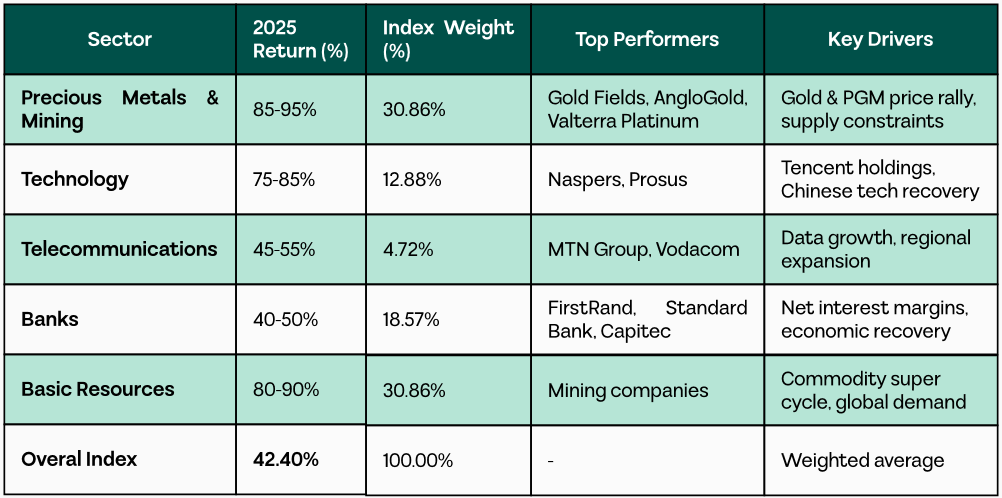
Market performance in 2025 was highly concentrated in a narrow group of sectors. Precious metals and mining stocks were the primary drivers of index-level gains, supported by rising gold and platinum group metal prices amid persistent global supply constraints. Technology stocks, led by Naspers and its subsidiary Prosus, also contributed meaningfully as renewed investor appetite for Chinese technology boosted the valuation of their Tencent exposure. Telecommunications recorded solid gains, though performance was largely driven by African operations outside South Africa, reinforcing the importance of regional diversification and offshore earnings streams. In contrast, banking sector performance remained mixed, with gains constrained by muted domestic loan growth, cautious credit demand, and conservative investor positioning toward the local economy (Reuters, 2025).
JSE Sectoral Performance and Index Weights, 2025
This concentration meant that index-level gains masked weak performance across many domestically exposed mid-cap and consumer names.
Market depth remains exceptional by global standards
The JSE maintained a liquidity ratio of 31.06%, reinforcing its status as Africa’s most tradable equity market (JSE Market Statistics, 2025). Institutional participation remained robust, though turnover was increasingly concentrated in large-cap resource and offshore-earning stocks. Smaller domestic firms continued to experience thinner trading volumes, reflecting selective risk appetite rather than systemic liquidity stress.
A bifurcated market reflects unresolved structural constraints
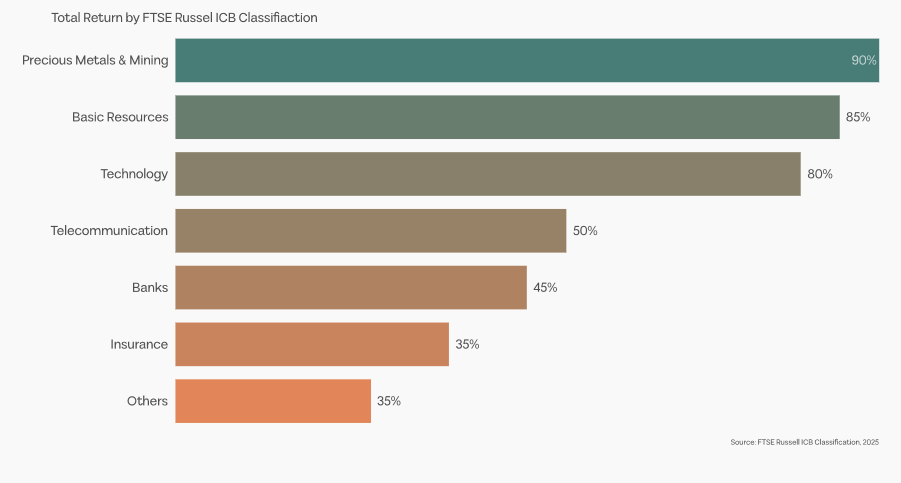
South Africa’s 2025 equity performance revealed a clear bifurcation. Companies with offshore earnings exposure and commodity leverage significantly outperformed domestically focused businesses, reflecting ongoing investor caution toward the local economy.The formation of a Government of National Unity (GNU) following the May 2024 elections initially boosted expectations of accelerated reform, particularly in energy, logistics, and governance (Business Day, 2025). However, reform execution proved slower than anticipated, with electricity supply constraints, port inefficiencies, and regulatory bottlenecks continuing to weigh on sentiments.
JSE 2025 Sector Returns: Resources Dominate with +90% and 85%
Outlook: breadth, not momentum, will define the next phase
Consensus forecasts point to approximately 10% equity returns in 2026, with expectations that performance will broaden beyond resource-heavy sectors. A rotation toward domestic value stocks is anticipated if reform momentum strengthens and macroeconomic stability improves. Until then, the JSE is likely to remain driven by global cycles, commodity dynamics, and offshore earnings exposure rather than domestic growth alone.
Nigerian Exchange (NGX) – Nigeria
Market scale anchors West Africa’s largest economy
The Nigerian Exchange ranks as Africa’s second-largest stock exchange by market capitalization, serving the continent’s most populous economy with a GDP of approximately US$334.3 billion (IMF, 2025). Following its transformation from the Nigerian Stock Exchange to the Nigerian Exchange Group in 2021, the NGX has modernized capital markets infrastructure, improving transparency, trading efficiency, and international investor access (NGX Group, 2025). As the gateway to over 220 million people, the exchange plays a critical role in mobilizing capital for economic development while offering investors exposure to one of Africa’s most dynamic consumer markets.
The outperformance of stocks has been striking
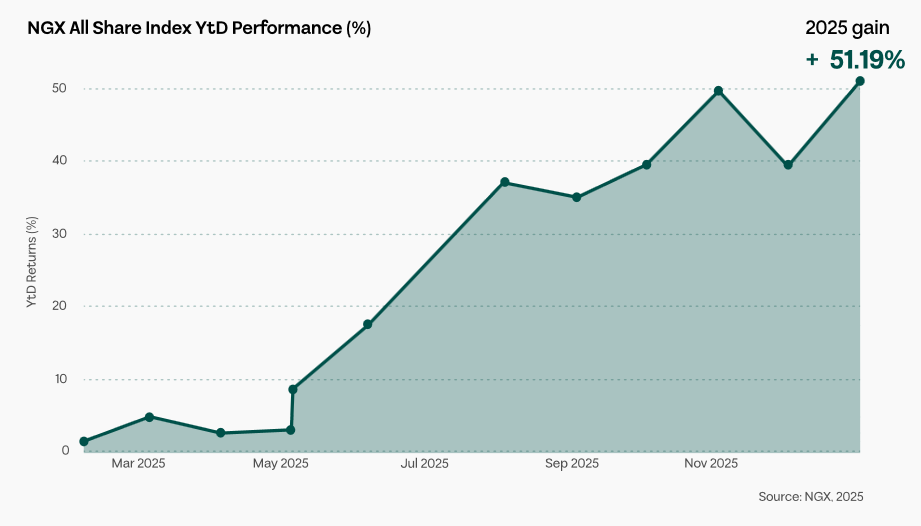
Equity returns in 2025 were exceptional. The NGX All-Share Index gained 51.19% in local currency terms, representing the strongest annual performance in nearly two decades (Nigerian Exchange, 2025). Currency depreciation, however, moderated USD-denominated returns to 15.3%, illustrating the significant headwinds faced by international investors despite strong underlying equity gains (Bloomberg, 2025). Market capitalization expanded strongly, rising 25.83% from US$60.1 billion to US$75.7 billion in Q3 2025, before closing the year at approximately NGN 99.8 trillion (~US$62 billion) (NGX Market Statistics, 2025).
NGX Monthly Performance 2025
Valuations reflect strong growth expectations
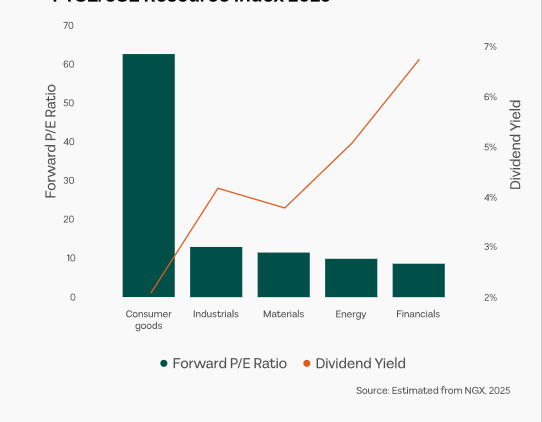
Forward price-to-earnings ratios varied considerably across sectors. Consumer Discretionary traded at elevated multiples of 62.3x, signaling high investor expectations for continued growth, while Financials maintained more moderate valuations consistent with historical norms. Dividend yields remained competitive,competitive, particularly in banking, where major lenders balanced attractive payouts with reinvestment for expansion.
NGX Valuation Metrics by Sector
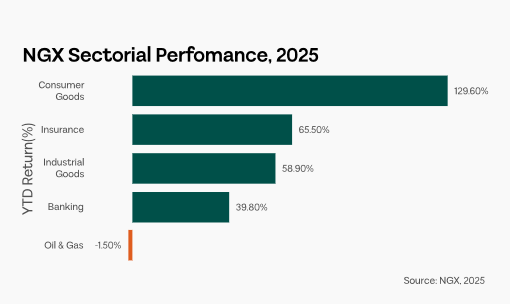
NGX Sectorial Performance 2025
Sector leadership was concentrated but meaningful
Performance was driven by a limited set of sectors. Banking stocks benefited from naira devaluation through revaluation gains on foreign currency assets, expanded net interest margins, and increased transaction volumes amid higher interest rates. The consumer goods sector emerged as a major driver, led by Dangote Cement, which reached a market capitalization milestone of NGN 11 trillion (NGX, 2025), reflecting investor confidence in infrastructure development and urbanization trends. Insurance stocks remained resilient, supported by regulatory reforms and rising middle-class insurance penetration, while oil and gas gains were more modest, reflecting global energy price dynamics and subsidy reforms. Telecommunications continued to lead through subscriber growth, increased data usage, and digital financial service expansion despite regulatory pressures.
Market dynamics underscore reform-driven gains
Nigeria’s 2025 equity market performance was shaped by a convergence of economic reforms. Key measures included currency liberalization, petroleum subsidy removals, electricity tariff reforms, and regulatory improvements designed to increase transparency and investor confidence (Central Bank of Nigeria, 2025; IMF, 2025). These policies initially created volatility and inflationary pressures, but ultimately strengthened investor conviction and attracted portfolio inflows.
Banking stocks were particularly advantaged, benefiting from foreign exchange revaluation, higher margins, and increased transaction fees under a cash-lite policy environment, while consumer-oriented companies demonstrated resilience, maintaining market share and passing through cost increases to customers across staples, cement, and building materials.
Sector leadership was narrow but powerful
Corporate earnings projections suggest a maturing growth trajectory. Consumer Staples, which previously delivered extraordinary growth under subsidy-induced distortions, are expected to achieve more sustainable 48% annual growth over the next five years as volume growth becomes the primary driver (Meristem Securities, 2025). Financials, including banks and insurance firms, are projected to grow 15% annually, supported by expanding financial inclusion, higher interest margins, increased transaction volumes, and ongoing digital banking innovation (ARM Securities, 2025).
Overall, the market maintains a positive earnings trajectory, underpinned by fiscal consolidation from subsidy reforms, improved currency stability, and reduced macroeconomic volatility, enabling longer-term strategic investment,however, caution should be maintained as continued earnings realization depends on the government sustaining reform momentum, managing inflation, maintaining currency stability, and addressing security risks affecting operations in certain regions.
Casablanca Stock Exchange (MASI) – Morocco
Stability anchors North Africa’s most institutional market
The Casablanca Stock Exchange stands out as North Africa’s most stable and institutionally developed equity market. Strong regulation, high corporate governance standards, and a deep domestic investor base, dominated by pension funds and insurance companies, provide consistent liquidity and limit volatility (AMMC, 2025). Morocco’s political stability and strategic position linking Europe and Africa reinforce the MASI’s role as a regional gateway for international investors.
Strong equity returns were preserved in USD terms
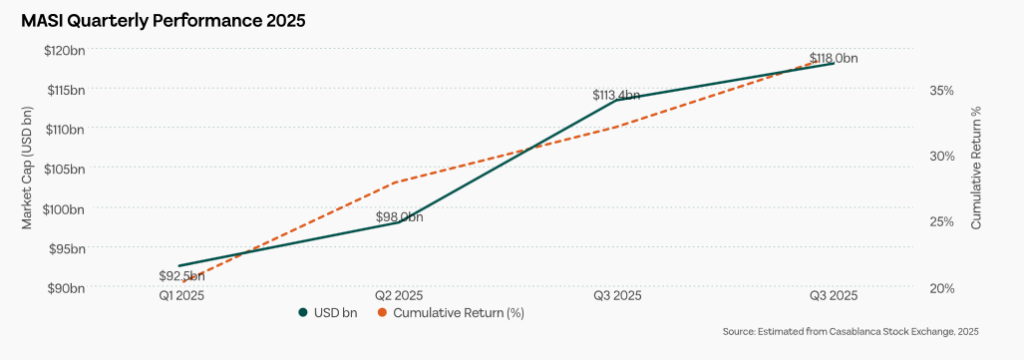
The MASI delivered a 52% local-currency return through September 2025, ranking among Africa’s top-performing markets (Attijari Global Research, 2025). Unlike many frontier peers, Morocco’s managed exchange-rate regime ensured that currency movements had minimal impact on foreign investors, allowing USD returns to closely mirror local performance. Market capitalisation increased 11.9% to US$113.4 billion by Q3 2025, reflecting both price gains and renewed foreign interest (MCMA, 2025).
MASI Quarterly Performance 2025
Market depth and valuation discipline support durability
Market capitalization represents a high share of GDP, underscoring the MASI’s importance in domestic capital formation (IMF, 2025). Despite strong price appreciation, valuation multiples remained moderate, supported by predictable earnings from mature sectors such as banking, telecommunications, and utilities. Liquidity remained stable throughout the year, anchored by long-term domestic institutions rather than volatile foreign flows.
Financials and industrials drove performance
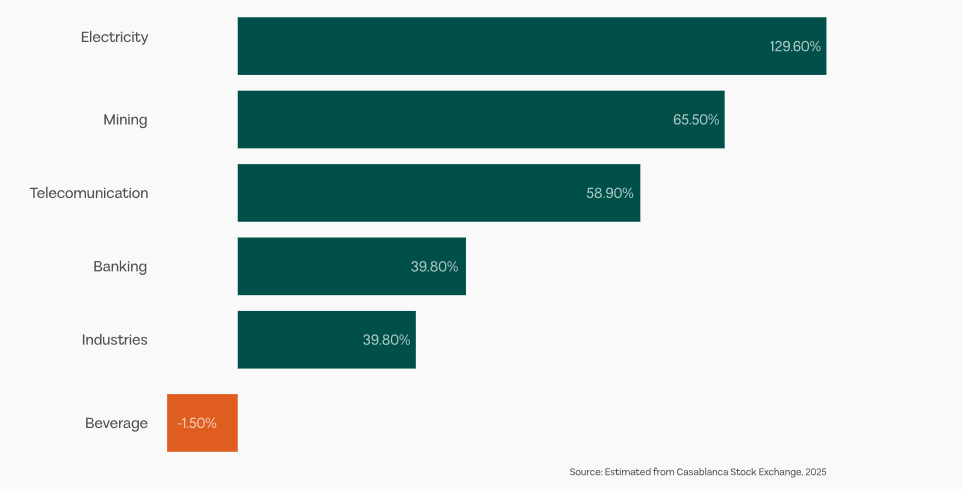
Banking stocks led market gains, supported by rising net interest margins, steady loan growth, and resilient fee income. Major lenders consistently exceeded earnings expectations, sustaining investor confidence (BMCE Capital Research, 2025). Industrials also performed strongly, benefiting from Morocco’s role as a manufacturing and export hub for Europe, while selective real estate stocks gained on easing rate expectations and housing initiatives.
MASI Sectoral Breakdown 2025
Policy credibility and European integration underpin confidence
Morocco’s 2025 equity performance was underpinned by credible macroeconomic management, strong domestic liquidity, and improving ESG perceptions (IMF, 2025; MSCI, 2025). Primary market activity, including new IPOs, reinforced confidence in public equity financing. Close trade integration with Europe continued to support earnings stability for export-oriented firms, anchoring long-term valuations (European Commission, 2025).
Outlook: a low-volatility anchor within African equities
While returns are likely to normalize after an exceptional 2025, the MASI remains well positioned as a defensive, low-volatility allocation within African equities. Institutional depth, currency stability, and durable earnings profiles continue to differentiate Morocco from higher-beta frontier markets.
Egyptian Exchange (EGX) – Egypt
Reform credibility underpins market recovery
The Egyptian Exchange is one of Africa’s largest equity markets, offering broad sectoral exposure across banking, real estate, industrials, and consumer goods. Market sentiment improved materially following the implementation of IMF-backed economic reforms, which addressed foreign exchange distortions, subsidy inefficiencies, and fiscal sustainability challenges (IMF Egypt Program, 2025). Egypt’s large population of over 105 million and its strategic position linking Africa, the Middle East, and Europe continue to support long-term growth prospects despite near-term macroeconomic pressures (World Bank, 2025).
Equity returns rebounded strongly from depressed levels
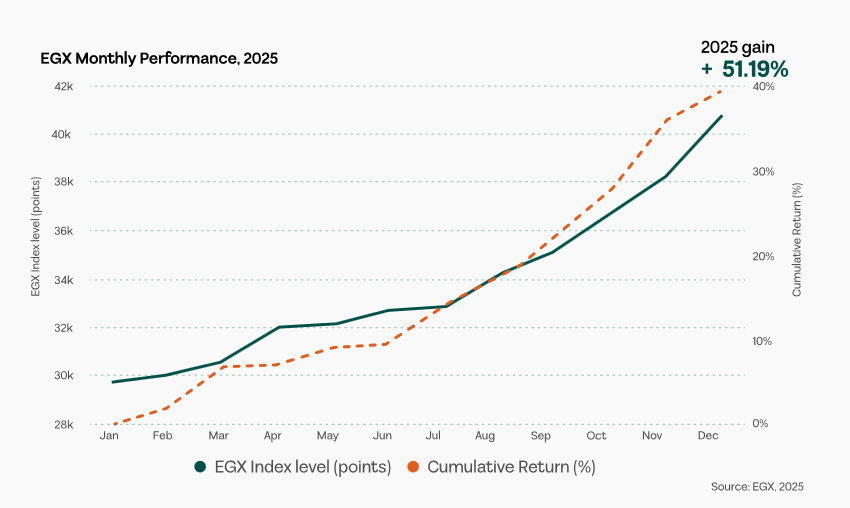
The EGX 30 Index delivered a 39.15% return in local currency terms in 2025, marking a strong recovery from prior periods of volatility and underperformance (EGX Market Data, 2025). Market capitalisation rose 11.6% in Q3 2025, reaching approximately US$51.4 billion, supported by equity price appreciation and renewed foreign investor participation following reform implementation (EGX Quarterly Report, 2025). While market size remains below pre-devaluation peaks, this gap highlights significant upside potential should macroeconomic stability continue to improve.
EGX Monthly Performance 2025
Banks and real estate led sectoral gains
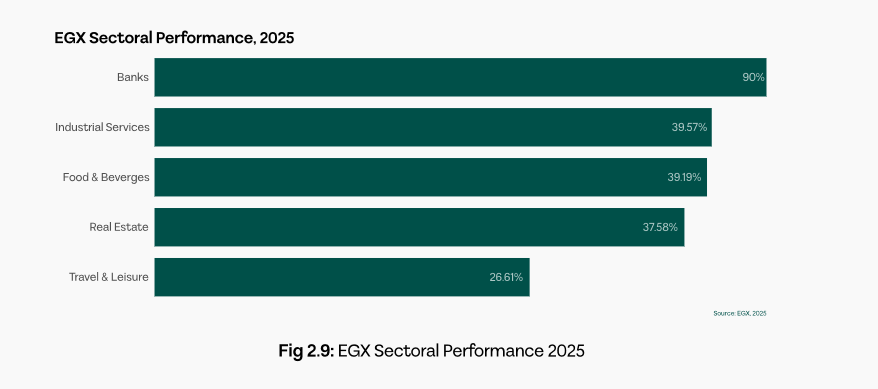
The banking sector was the primary driver of market performance, benefiting from foreign exchange liberalisation, improved pricing discipline, and expanding credit activity. Major lenders such as Commercial International Bank and QNB Alahli saw improved sentiment as macroeconomic uncertainty eased. Real estate also outperformed, supported by recovering domestic demand, diaspora investment, and spillovers from large government infrastructure projects (Egyptian Real Estate Association, 2025). Broader financial services gained from higher capital market activity, while utilities attracted interest on expectations of long-term growth following tariff reforms.
EGX Sectoral Performance 2025
Inflation and currency risks did not derail the equity recovery
Despite elevated inflation and multiple currency devaluations, the EGX demonstrated notable resilience in 2025. Both foreign and domestic investors increased participation as confidence in policy direction improved, reversing years of underweight positioning. Corporate revenues grew strongly, averaging 40% annually over the past three years, reflecting pricing power, operational efficiency gains, and currency-linked revenue advantages for exporters and dollar earners (Renaissance Capital Egypt, 2025).
Outlook: valuation-driven upside remains
The EGX offers scope for further re-rating if inflation moderates, currency stability improves, and reform momentum is sustained. Egypt’s equity market is increasingly viewed as a recovery and valuation-driven opportunity within African equities rather than a purely cyclical trade.
Nairobi Securities Exchange (NSE) – Kenya
East Africa’s anchor equity market
The Nairobi Securities Exchange is one of the most developed equity market in East Africa and the primary capital market for the East African Community. It anchors Kenya’s diversified economy and benefits from relatively strong institutions, advanced financial services, and a deep telecommunications backbone.
Continued market modernisation through automated trading, enhanced disclosure, and expanded product offerings has strengthened the NSE’s role as a regional financial hub, despite ongoing challenges related to public debt and political risk.
Strong local returns, moderated by currency effects
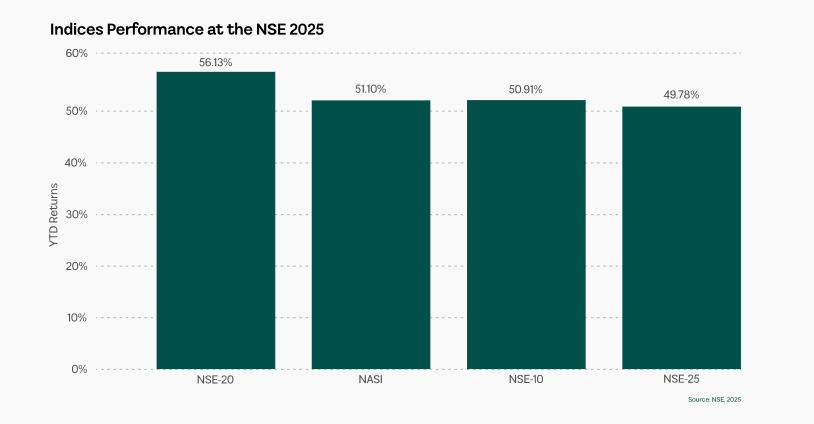
The NSE All-Share Index delivered a return of 55.1% in local currency terms in 2025, marking one of its strongest annual performances in recent years (NSE, 2025). USD returns reached 24.3% in the first half of the year, but depreciation of the Kenyan shilling reduced full-year dollar outcomes, reinforcing currency risk as a key consideration for foreign investors. Market capitalisation expanded notably in Q3 2025, supported by earnings growth and renewed investor confidence, while valuation multiples remained moderate relative to historical levels and regional peers.
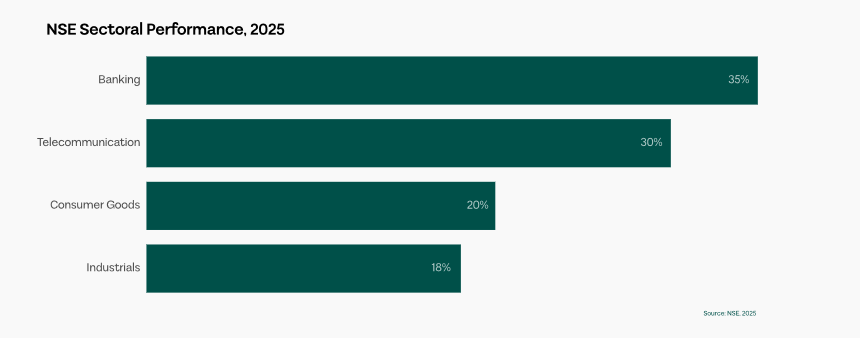
NSE Indices Performance 2025
Valuations supported by income-generating sectors
Despite the rally, NSE valuations remained reasonable. Dividend yields were particularly attractive in banking and telecommunications, where mature business models and strong cash generation supported consistent payouts. This income profile helped sustain investor demand amid global risk repricing and frontier market volatility.
Banks and telecoms drove market performance
The banking sector was a key contributor to returns, with leading lenders benefiting from declining non-performing loans, steady credit growth, and expanding digital banking channels. Improved asset quality and regional diversification supported earnings resilience. Telecommunications, led by Safaricom, continued to outperform on the back of mobile money expansion, rising data usage, and diversification into adjacent digital services. Consumer goods and industrials also performed solidly, supported by resilient domestic demand and infrastructure-led activity.
Equity performance was underpinned by improved political stability, policy continuity, and strong corporate execution. However, foreign investor participation declined to 28.01% in September 2025, a 15-year low, reflecting global EM outflows and Kenya-specific concerns around debt sustainability and currency volatility. This decline was largely offset by rising participation from domestic pension funds, insurers, and retail investors, creating a more stable and long-term oriented investor base.
Key risks: liquidity and foreign capital withdrawal
Persistent foreign outflows pose risks to liquidity, currency stability, and valuation sustainability, particularly for mid- and small-cap stocks. Structural challenges remain around market depth, governance enforcement, and regional regulatory harmonisation. While ongoing NSE reforms aim to address these constraints, liquidity fragmentation continues to limit broader capital formation.
Outlook: income-led resilience with selective upside
The NSE offers a yield-supported equity opportunity within African markets, driven by banks and telecoms with strong cash flows and defensive characteristics. While currency risk and foreign investor retreat cap near-term upside, sustained earnings delivery and growing domestic participation provide a stabilising foundation for medium-term returns.
Ghana Stock Exchange (GSE) – Ghana
From debt distress to Africa’s best-performing market
The Ghana Stock Exchange delivered Africa’s strongest equity performance in 2025, marking a dramatic reversal from the sovereign debt crisis and market collapse of prior years. The rally followed the successful completion of domestic and external debt restructuring and the implementation of a $3 billion IMF-supported stabilization programme, which restored fiscal credibility, normalized foreign exchange markets, and rebuilt investor confidence. Ghana’s experience underscored how credible reforms can rapidly reprice risk and unlock equity upside.
A market-leading rally, supported by currency stability
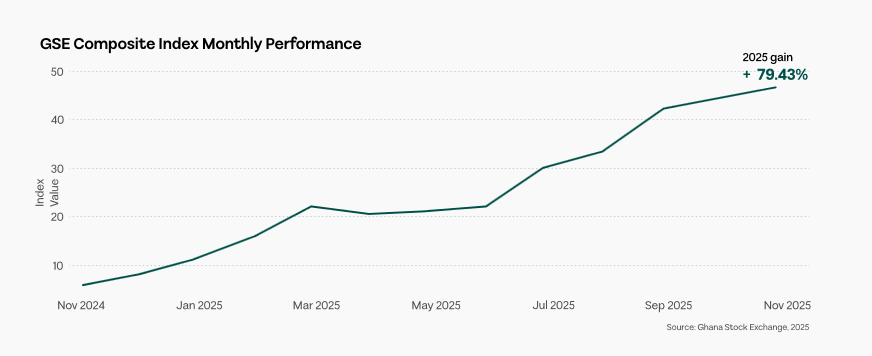
The GSE Composite Index surged 79.43% in local currency terms, ranking as one of the world’s top-performing equity indices in 2025. USD returns reached 81% by September, supported by unexpected cedi stability and mild appreciation as IMF programme execution eliminated parallel FX markets and improved reserve buffers. Market capitalisation rebounded sharply from crisis lows, rising to $13.2 billion by Q3 2025, signalling a partial normalization of equity valuations.
GSE Monthly Performance 2025
Banks and financials led the recovery
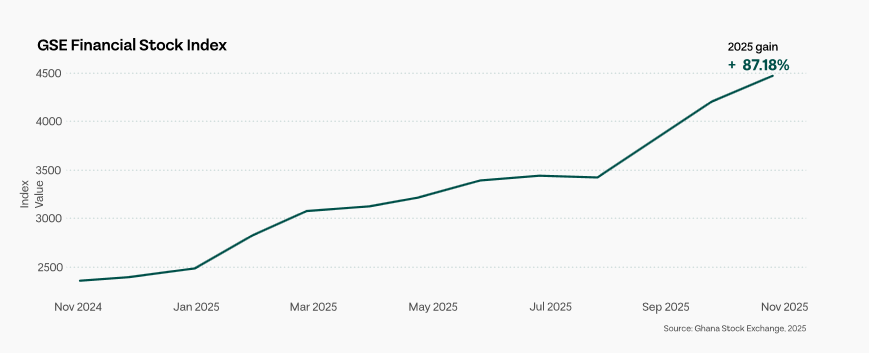
The banking sector was the dominant driver of index gains. Major lenders rebounded as debt restructuring clarified losses on government securities, recapitalisation was completed, and liquidity conditions improved. Broader financial services, including insurers and asset managers also recovered as regulatory uncertainty eased and capital market activity resumed. Consumer goods and cocoa-linked firms added momentum, benefiting from moderating inflation and supportive global commodity prices.
GSE Financial Stock Index Performance
Consistency, not speculation, defined the rally
The equity recovery was broad-based and persistent. The GSE posted positive returns in 9 of 12 months, with notable rallies in March (+10.19%), July (+11.88%), and September (+11.37%), each linked to concrete reform milestones and improving macro data. This consistency reflected sustained capital reallocation rather than short-lived speculative inflows.
IMF programme and debt restructuring as core catalysts
The IMF Extended Credit Facility anchored the recovery by enforcing fiscal consolidation, restoring monetary credibility, and stabilizing the currency. Completion of debt restructuring under the G20 Common Framework reduced debt service burdens, extended maturities, and created fiscal space. These reforms catalyzed the return of foreign portfolio investors, while domestic pension funds and institutions after absorbing restructuring losses gradually rebuilt equity exposure as risk perceptions improved.
Outlook: strong recovery, tighter margin for error
Ghana’s equity market now reflects a post-crisis repricing, with much of the recovery narrative embedded in valuations. Sustaining performance will depend on continued reform discipline, earnings delivery, and currency stability. While upside remains, the risk-reward balance has shifted from distressed recovery to selective, fundamentals-driven opportunities.
BRVM (Bourse Régionale des Valeurs Mobilières) – West Africa
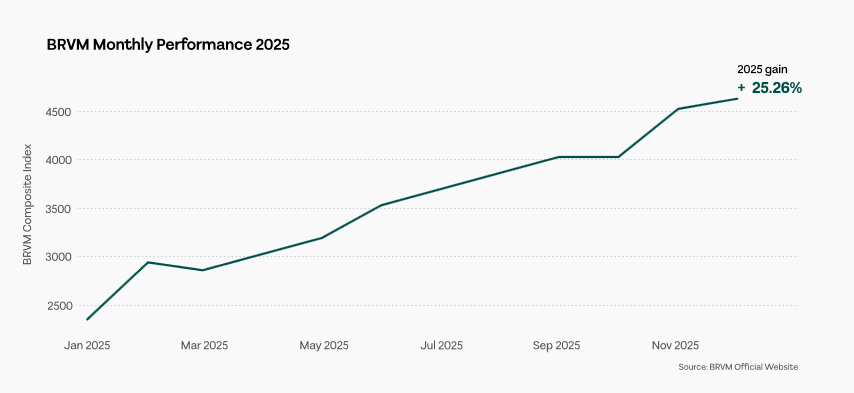
The BRVM, serving eight West African economies within the CFA franc zone, recorded 25% local currency returns in 2025, supported by macro stability, improving corporate earnings, and growing investor interest. The USD return of 29% reflected the CFA franc’s euro peg, offering exchange rate predictability and shielding investors from currency volatility common elsewhere in Africa. Market capitalization exceeded $50 billion, with Côte d’Ivoire alone accounting for 35% of total market cap, driven by strong industrial and agricultural performance.
BRVM Regional Performance 2025
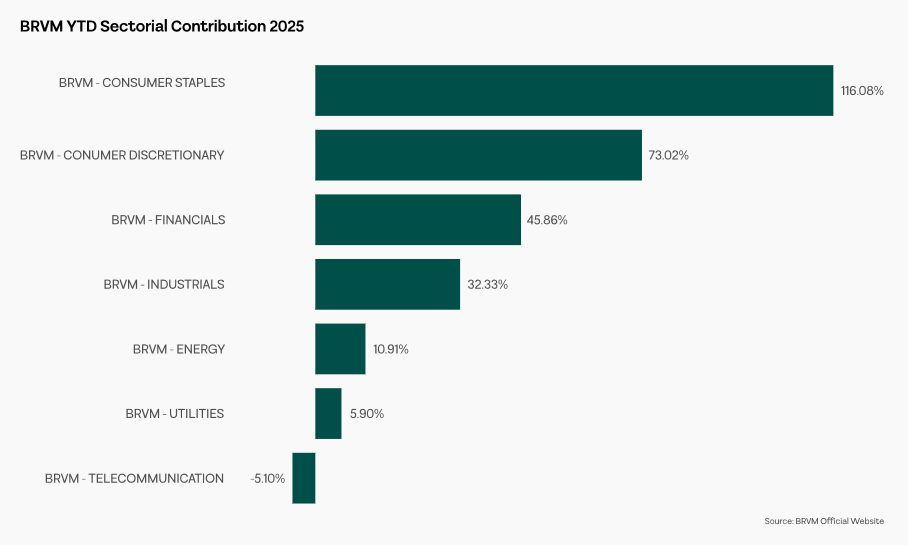
Banks and telecoms anchor the regional rally
Regional banks including Ecobank, Bank of Africa, and Société Générale subsidiaries leveraged cross-border networks to capture rising credit demand, financial inclusion growth, and mobile money adoption. Telecommunications operators, led by orange Côte d’Ivoire and Moov Africa, benefited from expanding data consumption and mobile financial services. Consumer goods firms gained from harmonized trade protocols eliminating internal tariffs, while utilities saw growing investor interest amid infrastructure expansion.
BRVM Sectoral Contribution 2025
CFA stability and regional diversification reduce risk
The euro-pegged CFA franc eliminated intra-regional currency risk, providing predictable returns in euro terms. Cross-border access via a unified trading platform enabled portfolio diversification across eight economies, reducing concentration risk. Retail investor participation rose, especially in urban centers such as Abidjan, Dakar, and Ouagadougou, stabilizing long-term capital and improving liquidity in major stocks.
Lusaka Securities Exchange (LuSE) – Zambia
Copper-driven recovery fuels market surge
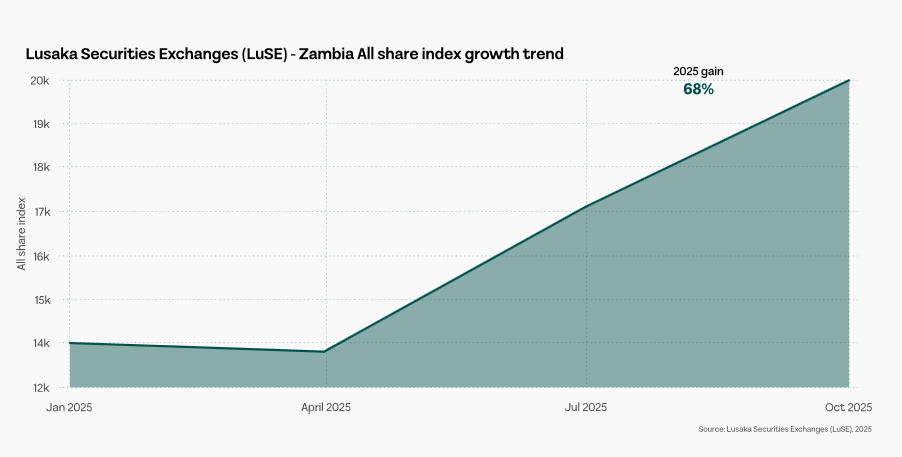
The LuSE All-Share Index gained 68.1% in local terms. Rising global copper prices, which account for 70% of Zambia’s export revenues, combined with successful sovereign debt restructuring under the G20 Common Framework and IMF program, drove investor confidence and supported market recovery.
LuSE Annual Performance 2025
Mining dominance and diversified financial support
Copper producers, led by First Quantum Minerals, drove market gains as supply constraints and rising global demand from renewable energy and electric vehicle value chains supported prices. Banking and consumer goods stocks recovered in parallel, reflecting improved liquidity conditions, declining non-performing loans, and a gradual rebound in consumer confidence. Telecommunications continued to expand, underpinned by urbanisation trends and the accelerating adoption of mobile money and digital services.
Policy credibility restores investor trust
Debt restructuring resolved Eurobond and Chinese loan obligations, reducing default risk and reopening access to international markets. Improved fiscal discipline, adherence to IMF programmes, and progress on structural reforms strengthened investor confidence. As a result, foreign capital gradually returned, reinforcing domestic participation and helping to sustain market momentum.
Stock Exchange of Mauritius (SEM) – Mauritius
Tourism and financial services drive dual-market growth
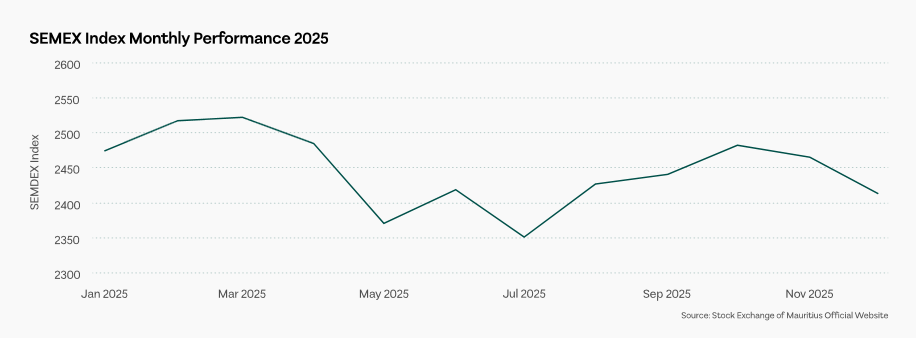
The SEM operates as both a domestic exchange and an international gateway, supported by a recovery in tourism and sustained growth in Global Business and financial services activity.
SEM Monthly performance 2025
Luxury tourism rebounds while financial flows stabilize
Luxury tourism operators surpassed pre-pandemic occupancy and pricing, supported by diversified international arrivals, while financial services sustained steady investment flows through the Global Business segment.
SEM combines domestic resilience with continental exposure
SEM’s dual structure helps reduce risk by pairing resilient domestic equities with international capital flows targeting African growth. Supported by tourism recovery, strong financial services, and safe-haven attributes, the exchange offers lower volatility and political risk than many larger African markets.
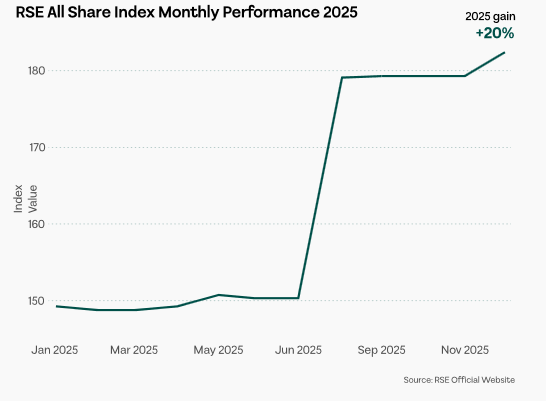
RSE All-Share Index Gained 20% in local currency terms, but 15% in USD terms due to currency depreciation. RSE demonstrates consistent expansion, conservative valuations, and strong governance. Market cap rose 10.3% in Q3 2025, reflecting price appreciation and new listings, while dividend yields remained steady for banks and telecoms. The exchange benefits from Rwanda’s political stability, Vision 2050 development targets, and strong rule-of-law environment.
RSE monthly performance 2025
Banking and telecoms drive investor confidence
Banks, led by Bank of Kigali, I&M Bank Rwanda, and Equity Bank Rwanda, leveraged mobile money penetration exceeding 70% (World bank, 2025), growing credit demand, and digital banking efficiency. MTN Rwanda drove telecommunications growth through subscriber expansion and 4G network coverage. Real estate and consumer goods sectors benefited from urbanization, rising middle class, and EAC trade integration.
Governance, policy, and modernization underpin stability
RSE’s stability is anchored in transparent regulation, strong investor protection, sound corporate governance, and consistent policy execution. Ongoing modernization through electronic trading, investor education, and regional cross-listings has improved access and participation. While growth is steady rather than rapid, reliable earnings expansion, a widening investor base, and continued capital-market development point to a solid platform for long-term deepening.
Fixed Income – Bonds and Credit Markets
African fixed income markets offer a wide range of opportunities and risks, shaped by differences in sovereign credit quality, currency stability, interest rate dynamics, and the depth of local corporate bond markets. In 2025, the continent saw divergent performance across countries, with yields reflecting local macroeconomic conditions, external financing pressures, and investor sentiment.
Sovereign Bond Yields and Yield Curves: Signals of Risk and Opportunity
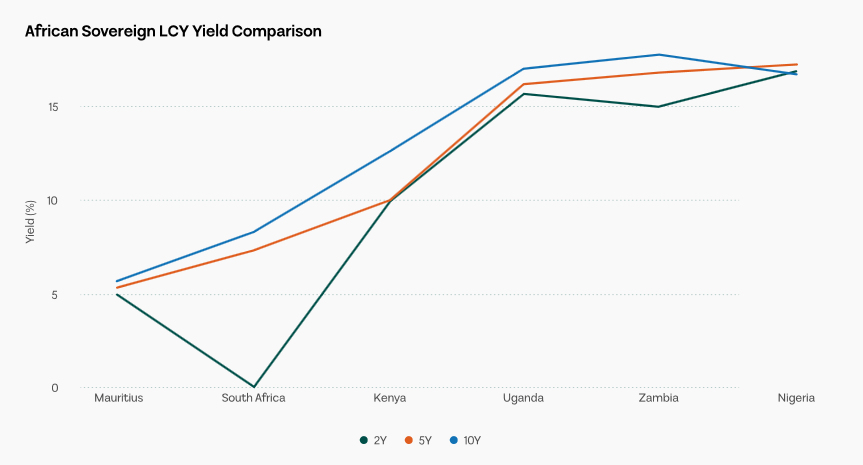
Sovereign yields remain the benchmark for African fixed income. Low-debt economies like Botswana and Mauritius offer moderate yields and high investor confidence, while higher-yielding markets such as Ghana and Zambia reflect elevated risk from debt pressures. South Africa’s moderate slope reflects stable inflation, whereas Nigeria’s steep curve points to fiscal and currency concerns. Investors use these curves to gauge risk and potential capital gains.
African Sovereign Yield Curves – 2Y, 5Y, 10Y, 30Y maturities
Credit Ratings and Spreads: Gauging Default Risk
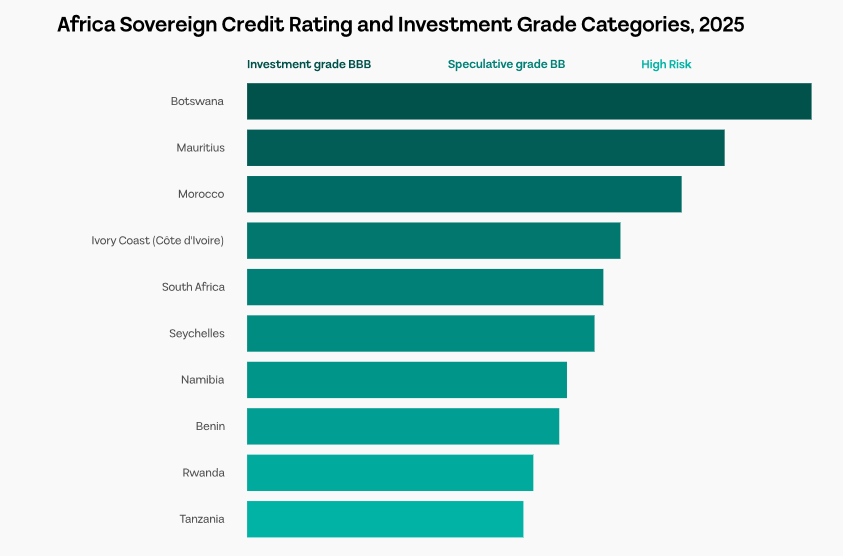
Credit ratings are key to assessing sovereign risk in African bond markets, and they directly affect bond yields and investor confidence. Investment-grade issuers like Mauritius (AA-) and Botswana (A-) trade close to U.S. Treasuries, hence their bonds are low-risk and offer returns similar to the safest global benchmark. These countries’ strong fiscal management and stable economies make the chance of default very low, so investors require only a small extra yield, called a spread, over U.S. Treasuries.
Most African countries, however, remain speculative grade, such as Ghana (B/B2) and Zambia (B+/B1), with wider spreads reflecting higher debt, commodity dependence, political risks, and economic volatility. Wider spreads can attract yield-seeking investors, but they come with higher risk and require careful analysis.
Africa Sovereign Credit Rating and Investment Grade Categories, 2025
Local vs Hard-Currency Bond Performance: The Currency Factor
In 2025, African fixed income highlighted the impact of currency exposure. Local-currency bonds, such as South African rand or Nigerian naira debt, offered higher yields but faced depreciation risk, while USD-denominated bonds reduced currency risk but remained sensitive to global interest rates. Zambian kwacha bonds benefited from domestic stabilization, boosting foreign returns, whereas Nigerian naira gains were offset by currency weakness.
African sovereign debt blends local and foreign issuance, bilateral loans, and concessional financing. Local bonds can deliver higher returns with volatility, while hard-currency bonds provide stability but track global conditions. Navigating these trade-offs is central to resilient African fixed-income strategies.
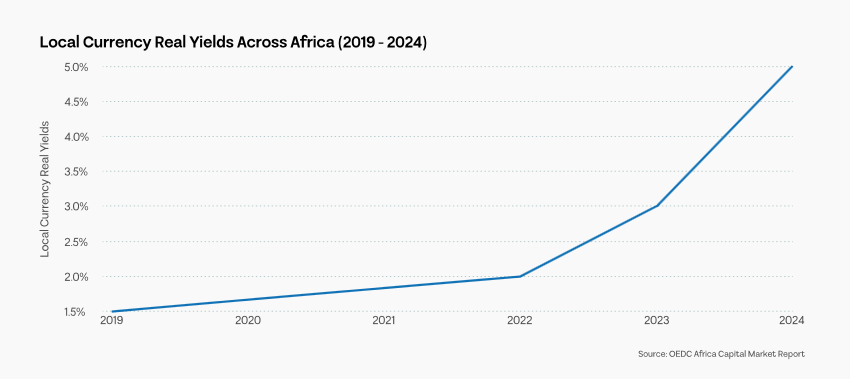
The upward trend in average real yields on local currency bonds across Africa from 2019 to 2024, rising steadily from approximately 1.5% in 2019 to a peak of around 5% by 2024
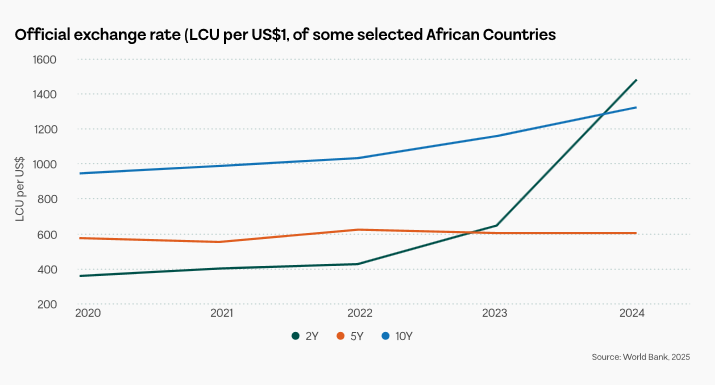
Official Exchange Rates (LCU per US$) in Selected African Countries, 2020–2024
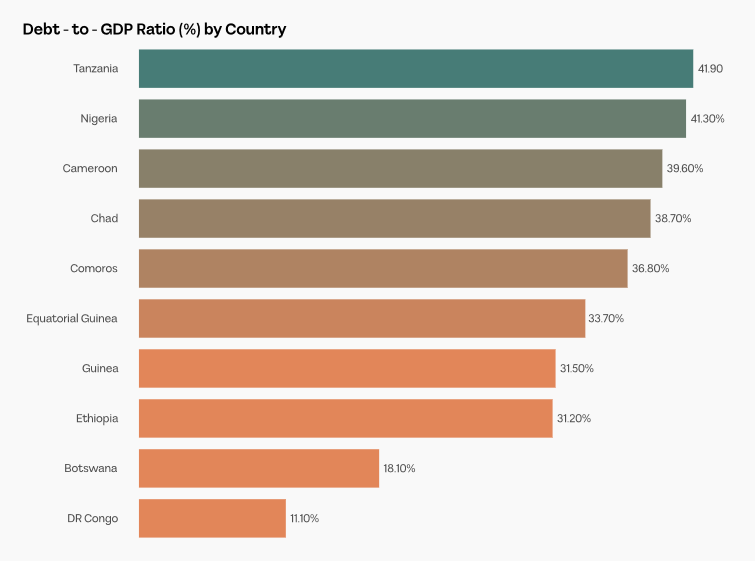
Debt sustainability is key to investor confidence. Metrics such as debt-to-GDP, debt service-to-revenue, and external debt-to-exports indicate a country’s long-term repayment capacity. Nations with conservative fiscal profiles, like Botswana and Mauritius, maintain stable debt and low default risk, supporting steady yields. In contrast, Ghana and Zambia, after debt restructurings, show higher but improving metrics.
These indicators help investors balance potential returns against the risk of restructuring or currency pressures.
Debt Sustainability Metrics Across Selected African Countries, 2025
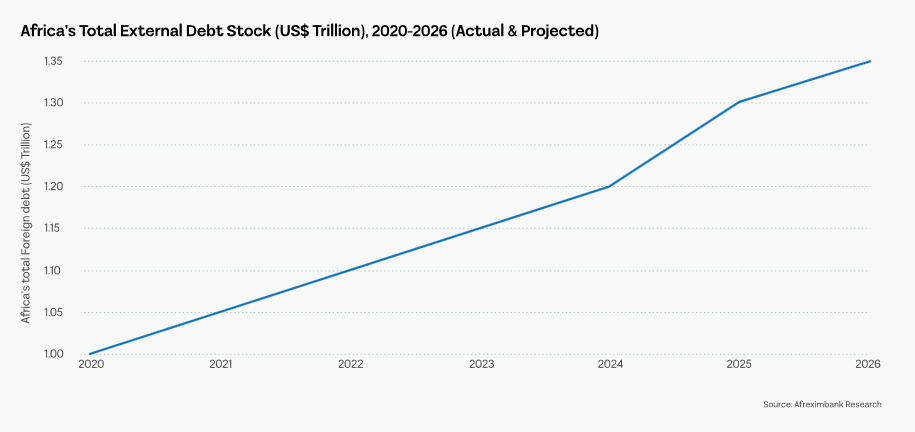
The steady upward trajectory of Africa’s total external debt stock (in US$ trillion)
Corporate Bond Market Depth: Emerging Opportunities
Africa’s corporate bond markets remain small and concentrated, with meaningful issuance mainly in South Africa, Nigeria, Kenya, and select Francophone countries. Large corporates in financial services, telecoms, infrastructure, and energy dominate issuance. South Africa hosts the continent’s most developed corporate bond market, offering a wider range of maturities and credit quality, while Nigeria has seen growing issuance and foreign participation, particularly in higher-yield bank and telecom bonds. Kenya’s market remains selective, with bonds mainly used to finance infrastructure and expansion projects.
Despite Africa’s rising need for long-term financing, corporate bonds play a limited role in corporate funding. Key constraints include weak regulatory and market infrastructure, a limited domestic institutional investor base, and governance challenges.
While African corporate bonds can offer yield and diversification opportunities, limited liquidity and uneven credit quality mean they are best suited to investors with strong credit discipline and longer investment horizons.
Comparative Sovereign Market Performance
In 2025, Ghana and Zambia emerged as high-yield performers, benefiting from successful debt restructuring and improving fiscal credibility, which produced some of the highest local currency returns for sovereign bonds in Africa. In contrast, fiscally conservative countries like Mauritius, Botswana, and South Africa offered steady performance, characterized by narrow spreads and low default risk. Performance also diverged along currency lines: hard-currency bonds outperformed local currency debt in countries experiencing domestic currency appreciation, while currency depreciation in Nigeria limited USD returns despite nominal local gains.
Risk Considerations for Fixed Income Investors
Investors in African fixed income markets face multiple risk factors. Currency risk is particularly relevant for local currency bonds in markets such as Nigeria and Ghana, where depreciation can offset nominal gains. Liquidity risk is notable in corporate bonds, which are often shallow and illiquid, requiring careful position sizing and longer investment horizons. Credit and sovereign risk remain key considerations, particularly for countries with restructuring history, high fiscal deficits, or heavy reliance on commodity exports. Additionally, global factors such as U.S. interest rate changes, commodity price volatility, and external financing needs can influence yields and spreads across the continent.
Summary: Investment Implications
African fixed income markets in 2025 offered a diverse spectrum of risk and return. High-yield opportunities were available in restructured economies like Ghana and Zambia, while fiscally conservative countries such as Mauritius, Botswana, and South Africa provided more stable but lower-yielding instruments. Emerging corporate bond markets offered potential for yield enhancement, though they required long-term commitment and careful credit selection. Currency management was critical for international investors, with hard-currency bonds providing protection against local depreciation.
Overall, the African fixed income landscape is maturing beyond sovereign-only markets, with expanding corporate issuance, improved fiscal transparency, and growing investor sophistication. These developments set the stage for portfolio diversification, yield enhancement, and cross-market risk management in 2026 and beyond.
Currencies – FX Markets and Volatility
FX as the Dominant Driver of Returns
In Africa, foreign exchange markets have evolved from a secondary macro factor to the primary driver of investment outcomes. Over the past decade, currency movements have increasingly determined USD-denominated returns across equities, fixed income, and alternatives, often outweighing underlying asset performance. Rising cross-country dispersion, persistent volatility, and pronounced downside risks mean FX is now an explicit allocation decision rather than a passive risk.
In 2025, African currencies proved more resilient than expected despite global volatility, supported by stronger domestic fundamentals.
FX Performance Against the USD and Global Peers
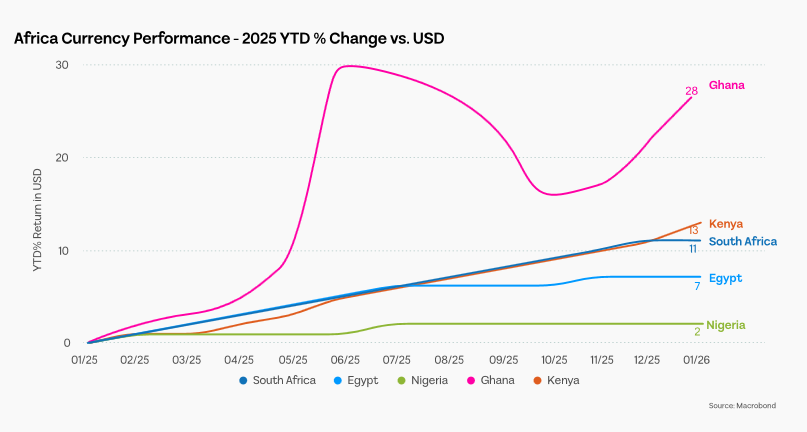
African currencies showed sharply divergent performance in 2025. Ghana, Uganda, and Zambia recorded strong appreciations of 28%, 24%, and 19%, reflecting successful currency stabilization and credible policy frameworks. In contrast, Tanzania and Ethiopia faced significant depreciation of 21% and 5%, driven by external financing pressures and reserve constraints. Nigeria and Egypt remained relatively stable, moving only 2% and 7%, while Kenya and South Africa posted moderate gains of 13% and 11%.
These differences are largely explained by policy credibility, reserve adequacy, and access to external financing, rather than underlying growth trends. The contrast between Ghana’s 28% gain and Tanzania’s 21% loss illustrates how policy frameworks and financing conditions have become the key determinants of FX outcomes. This reflects the structural fragility of African currency markets, where some economies achieve stability while others continue to face depreciation pressures, even within similar macroeconomic contexts.
Compared with emerging and frontier market peers, African currencies exhibit more frequent drawdowns, slower recoveries, and higher sensitivity to commodity and terms-of-trade shocks.
The year-over-year performance of eight major African currencies against the US dollar throughout 2025. Ghana emerged as the top gainers with appreciation of 28%, while Kenya, South Africa, and Egypt posted moderate gains ranging from 7% to 13%. Nigeria remained relatively stable with minimal changes at 2%
Volatility and Drawdowns: Evidence of a Regime Shift
African foreign exchange markets have shifted from episodic, event-driven volatility to a persistently elevated baseline. Structural factors such as thin liquidity, constrained policy space, and repeated external shocks have made heightened volatility the new norm for investors.
Currency drawdowns have become deeper and more prolonged, with slower recoveries. In 2025, Tanzania’s 21% decline unfolded steadily with little reversal, while Ghana’s early-year volatility took months to stabilize. This growing asymmetry between losses and gains increases the cost of unhedged positions and challenges short-term trading strategies. For portfolio managers, these dynamics signal a regime where traditional risk frameworks may no longer suffice.
Structural Drivers of African FX Performance
African currency movements are increasingly driven by structural factors rather than economic growth alone. Key drivers include FX market reforms, central bank credibility, tight foreign exchange supply, high debt servicing costs, and dependence on commodity exports. External factors, such as global interest rates and US Dollar strength, further influence currency performance, often overriding domestic growth trends. Together, these structural forces have transformed African currencies into instruments whose stability depends more on policy, reserves, and market architecture than on GDP growth.
Exchange rates that start overvalued are prone to sharp corrections, while countries that adjust gradually experience lower volatility. Adequate foreign reserves are now the key stabilizer, enabling faster recoveries from shocks. Liquidity constraints and capital controls add pricing premiums and tail risks. Stable currencies may offer lower nominal returns but preserve capital, whereas high-yield currencies carry persistent depreciation risk and rising hedging costs, limiting their net attractiveness for investors.
Implications for 2026
Looking ahead, FX will continue to dominate total returns across African asset classes. Dispersion across currency regimes is likely to remain high, with stability, reserve adequacy, and policy credibility outweighing nominal yield in determining investability. Elevated hedging costs will constrain foreign participation, reinforcing the importance of currency regime selection as a core portfolio decision.
Commodities in Africa – Exposure, Cycles & Global Demand
Global commodity markets have become increasingly fragmented, with energy, metals, and agriculture following distinct price paths. Energy prices remain volatile, shaped by geopolitical tensions and supply chain disruptions. Metals markets are now split: traditional industrial metals like copper and aluminum, and transition minerals such as lithium and cobalt, which are critical for renewable energy and electric vehicles. Agricultural prices are driven largely by climate shocks and trade restrictions rather than conventional demand trends.
Africa’s exposure to these changes varies widely across countries and sectors. Oil exporters like Nigeria face different pressures than mineral exporters such as Zambia or agricultural economies like Kenya. This uneven exposure is widening performance gaps across the continent, with commodity price movements increasingly shaping both economic and currency outcomes.
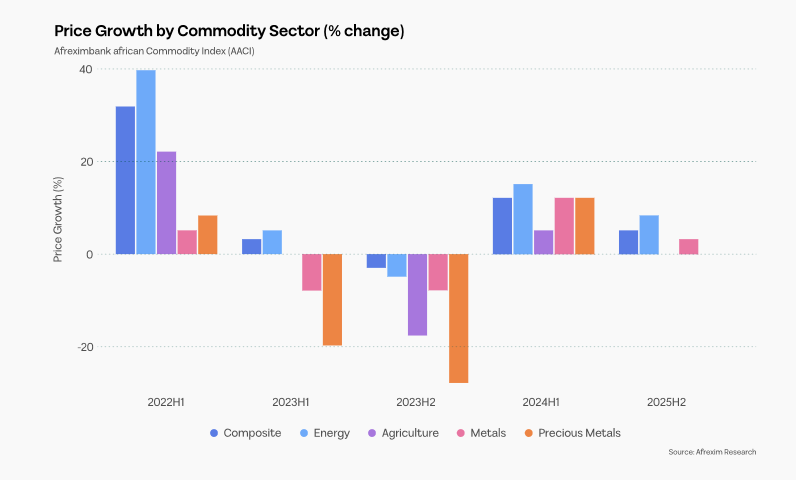
Evolution of Price Growth in the Afreximbank African Commodity Index (AACI) by Sector,Half-Year Intervals (2021–2025). It Highlights volatility in Agriculture and Precious Metals amid Energy-led composite fluctuations.
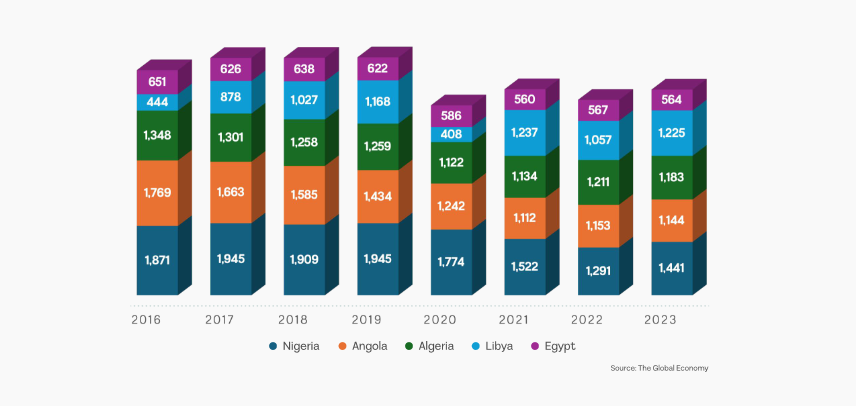
Energy production and consumption in African economies are significantly exposed to crude oil and gas markets, Africa contributed roughly 8% of global oil output in 2023. With major producers including Nigeria, Angola, Algeria, Libya, and Egypt. Nigeria leading production, although regional output has fluctuated due to investment and political instability.
Crude Oil Production (Thousands Of Barrels/day)
The chart above shows the level of crude oil production (thousands of barrels per day) in the top-ranking countries in Africa, the chart shows there has been decline in the total numbers of barrels produced per day from 2016 to 2023 with 2020 been the lowest due to the pandemic and economy lockdown. However,Nigeria which happens to be the country with the highest output per day has seen a -23% decline from 2016 to 2023, Angola -35%, Algeria -12%, Libya on the other hand had a 176% increment and Egypt -13% during the same duration.
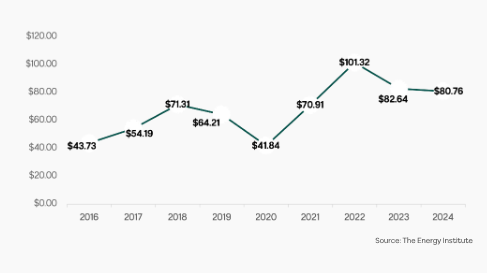
Global Crude Oil Price Per Barrel (USD)
Crude price has seen a 84.68% increment from 2016 to 2024 reaching an impressive high of $101.32 in 2022. Refined petroleum is increasingly relevant across Africa, Nigeria for example is building downstream capacity (e.g., Dangote Refinery, 650,000 b/d) and has partnered with standard and poor (S&P Global) to create a regional fuel price benchmark for West Africa, reflecting a shift toward more domestically relevant pricing structures. Energy prices have seen mixed performance globally, with West Texas Intermediate crude oil (WTI) and natural gas exhibiting volatility amid demand uncertainty. Recent daily commodity indices show natural gas and oil moving modestly in late 2025.
Meanwhile Metals such as copper, gold, platinum-group metals (PGMs) and chrome have remained central to African export performance.
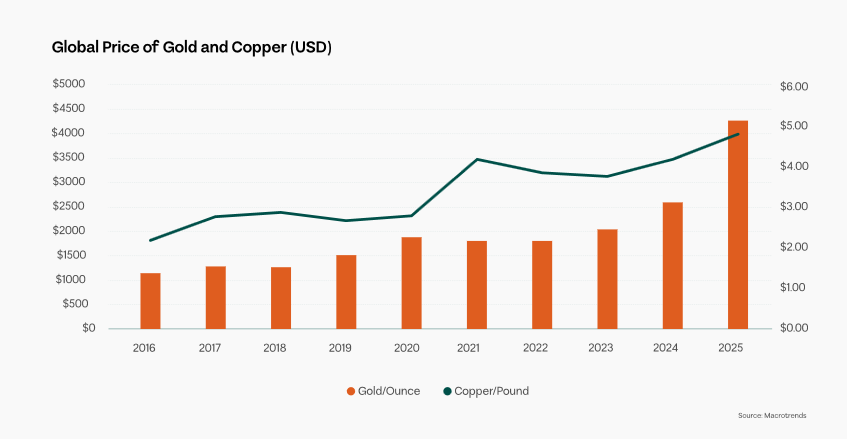
Global Price of Gold and Copper (USD)
Gold and Copper prices have reached all-time highs, a 275% increment in Gold and 118% in Copper from 2016 to 2025 driven by industrial demand and expectations around the energy transition, which benefits producers like the Democratic Republic of Congo producing 10% of global output and Zambia. Gold and PGMs have benefited from safe-haven demand and continued supply deficits, supporting export revenues for South Africa, Ghana, Tanzania, and others. South Africa remains dominant in ferrochrome and PGMs, though domestic fiscal policy proposals (e.g., chrome export taxes) have raised concerns among producers.
African agriculture features key cash crops (e.g., cocoa, coffee, fruits, nuts, cotton), with Africa holding sizeable comparative advantages in several categories: Edible fruits & nuts 9.6% global share, Cocoa 19.7% of world exports, Coffee & spices 10.3% global share according to AgriFocus Africa. Cocoa prices have historically experienced significant swings, having surged dramatically in recent years and creating income volatility for producers in Côte d’Ivoire and Ghana.
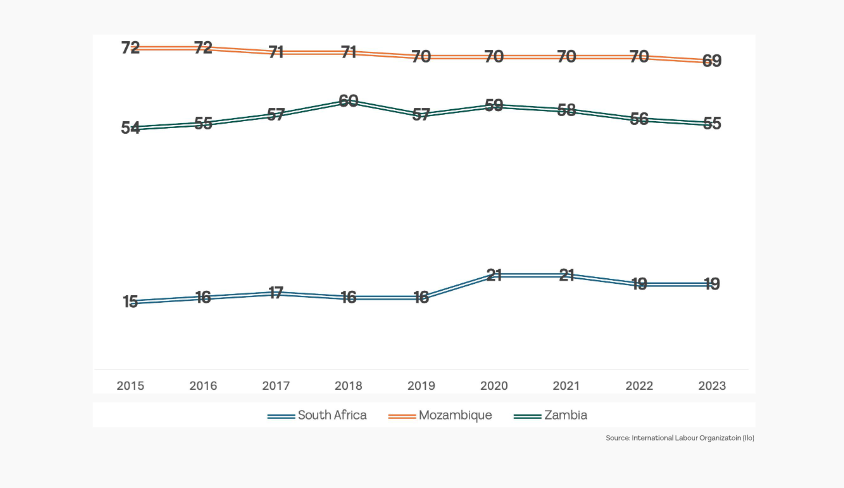
Agriculture remains a large employer (often >50% of working population) and contributor to GDP in many African countries, though export value growth has lagged industrial and service sectors in some instances.
Crude Oil Production (Thousands Of Barrels/day)
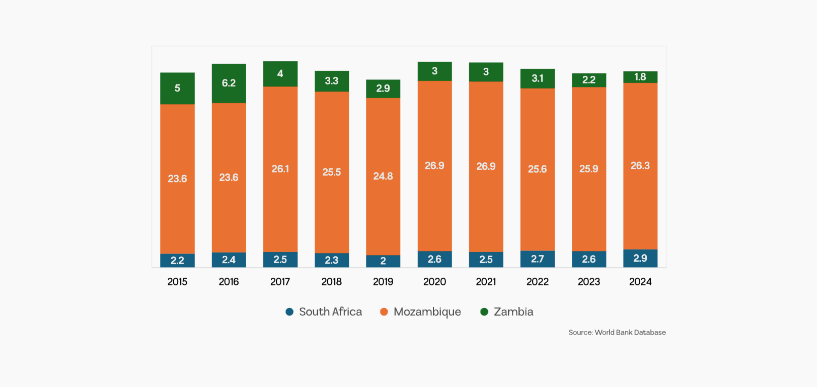
The chart above shows the percentage of labor force involved in agriculture in Southern Africa countries. Mozambique has a large percentage of it labor force involved in agricultural activities. Mozambique and Zambia are above the continental average of 50% while South Africa is low.
Agricultural % Of GDP In South Africa, Mozambique and Zambia
South Africa have the lowest percentage of labor force involved in agricultural activities and also have the lowest agricultural percentage of GDP, Mozambique have the highest in both share of GDP and participation while Zambia. The highlight the economic importance of agriculture in these countries.
Africa’s Share of Global Production
In Energy and Metals, Africa’s share of global commodity trade remains concentrated but reasonably modest. Metals & energy trade accounted for roughly 7.6% and 4.9% of global trade respectively in 2019 according to International Monetary Funds (IMF). Africa holds significant mineral reserves, Chromite 44% global share, Cobalt 57% global share, Gold 21%, Diamond 46%, Platinum & platinum-group metals dominated by South Africa 90%. Estimates suggest Africa contains 30% of the world’s critical mineral reserves, including key energy transition metals like lithium and cobalt, which are central to renewable technology supply chains.
In Agriculture, exports from sub-Saharan Africa constituted around 3.8% of global agricultural trade in 2019; this share varies significantly by commodity. Insights indicates that Africa’s high reserve shares contrast with lower global export shares, reflecting structural barriers such as processing capacity limits, infrastructure gaps, and incomplete value chains.
Export Concentration & Vulnerabilities
Africa’s export profiles remain heavily tilted toward commodities like oil, gold, copper, and cocoa still comprise over 70% of export earnings for the continent as a whole. The United Nation Conference on Trade and Development (UNCTAD) research indicates that many African economies export upwards of 60–80% of their goods in primary commodity form, exposing them to product concentration risk. Such concentration leaves economies sensitive to commodity price cycles, these low value chain investments has impacted trade balances, fiscal revenues, and FX flows across Africa.
Fiscal & FX Sensitivity
Governments reliant on commodity exports often see fiscal revenues and foreign exchange reserves tied to price instability. Oil price downturns can sharply reduce fiscal space in Nigeria, Angola, and other producers thereby affecting GDP.
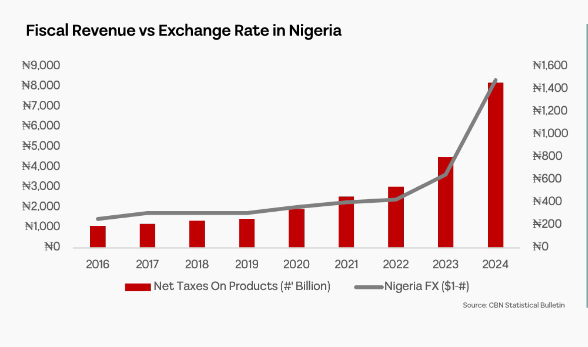
Nigeria for example has seen fiscal revenue and exchange rate head in the same direction highlighting the impact fiscal policies have on exchange rate and vice versa. It is also important to note that correlation isn’t equal to causation. The tax rate on good imported and exported into the country has an impact on the valuation of naira but is not necessarily the cause for the surge in exchange rate overtime. Precious metals like gold and copper can provide resilience during global economic stress, maintaining FX reserves for exporters.
Investment Vehicles
While specific instruments vary by market, key avenues include Exchange-listed mining and energy firms on the JSE, NGX, LSE, and other exchanges. Also tracking global metals and energy prices provide indirect exposure to African export dynamics (e.g., broader copper or gold ETFs)
Private equity and project finance historically played a large role in mining and Agri-commodity investment but have declined, slowing infrastructure development and diversification efforts.
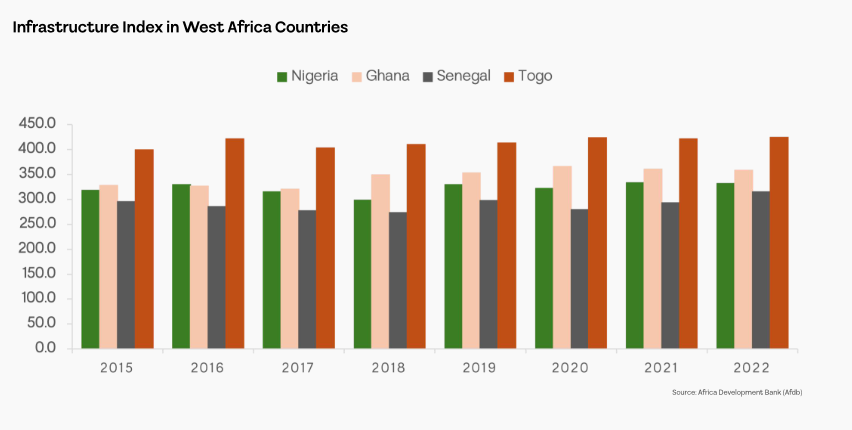
AFDB measure infrastructure progress in the countries by covering sectors such as energy, transport, ICT, water and sanitation. The chart above shows the slow progress of infrastructure in Nigeria, Ghana, Senegal and Togo. An increment of 4.22% in Nigeria, 9.1% in Ghana, 6.5% in Senegal and 6.2% in Togo from 2015 to 2022 respectively shows a slow investment by the Government. World bank suggests 8% of GDP should be invested in infrastructure to cover the infrastructure decay in Africa. Infrastructure vehicles such as public-private partnerships in transport and logistics are critical to reducing export bottlenecks.
Comparative Lens: Exposure Across Commodity Categories
Energy vs Minerals vs Agriculture
Energy (crude oil/oil) remains prone to geopolitical and cycle risks. While minerals are increasingly tied to long-term industrial demand (e.g., EVs, renewables) and may sustain structural growth. Agriculture on the other hand plays a fundamental role but is vulnerable to weather, disease, and global commodity cycles.
Transition Minerals & Long-Term Demand Trends
Africa’s role in the global energy transition is rising because of its strategic position in critical minerals like Cobalt, lithium, and copper are vital for electric vehicles, batteries, and renewable energy technologies and Africa holds material shares of global reserves. The drive to secure supply chains for clean energy has already attracted foreign investment in mining capacity and infrastructure.
In the long-term demand, global demand for minerals tied to the energy transition and is projected to grow sharply, potentially reshaping Africa’s export dynamics. Meanwhile continued infrastructure investment and value-addition (e.g., processing/refining) are key to enhancing Africa’s role beyond raw exports.
Conclusion: Opportunities and Risks
Africa’s resource wealth provides a foundation for export growth and global market integration, particularly in critical minerals and energy. Premium pricing for metals and strategic transition materials can expand fiscal space and investment capacity. Also, development of regional price benchmarks and downstream industries (e.g., refining) could enhance economic resilience and deepen markets.
The risks & structural challenges such as export concentration creates vulnerability to price fluctuations. Limited value addition and processing capacity mean Africa captures a small share of final value. While Infrastructure and financing gaps (e.g., declining project finance) constrain long-term growth.
Alternatives – Private Capital and Real Assets
Overview: Alternatives as Structural Return Drivers
Alternative investments have become an increasingly important pillar of African portfolios, offering access to long-term growth, structural transformation, and returns less correlated with public markets. Private equity, venture capital, infrastructure, real assets, and impact-oriented investments now play a central role in financing energy transition, digitalization, urbanization, and productivity gains across the continent. While these assets are inherently illiquid, their return profiles are shaped by long-duration cash flows, operational value creation, and exposure to secular growth themes rather than short-term macro volatility.
Private Equity and Venture Capital: From Experimentation to Scale
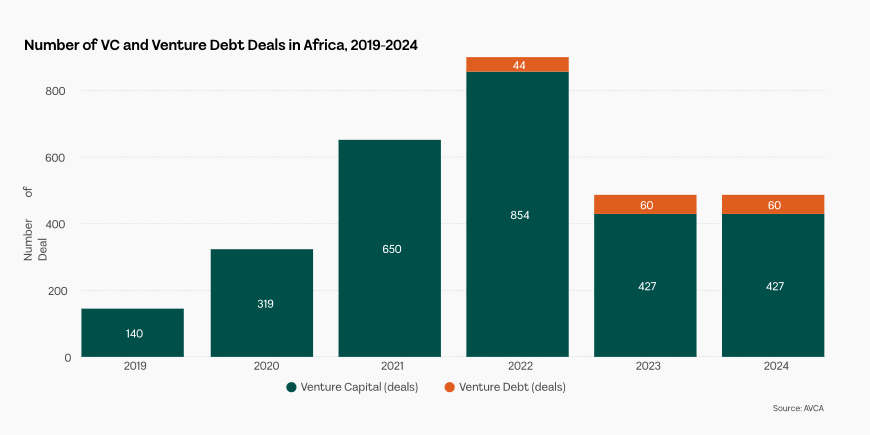
Africa’s private equity and venture capital ecosystem has expanded rapidly over the past five years, reflecting increasing market maturity. Venture deal volumes rose from approximately 140 transactions in 2019 to nearly 500 by 2024, alongside a steady increase in average deal sizes. This shift reflects a transition from early-stage experimentation toward growth-stage funding, supported by improved revenue visibility, stronger governance, and deeper global investor participation.
Venture Capital Deals in Africa
Deal activity in Africa has grown significantly over the last five years. According to AVCA, the number of venture capital deals rose from 140 in 2019 to an estimated 487 in 2024, reflecting a more mature and active ecosystem.
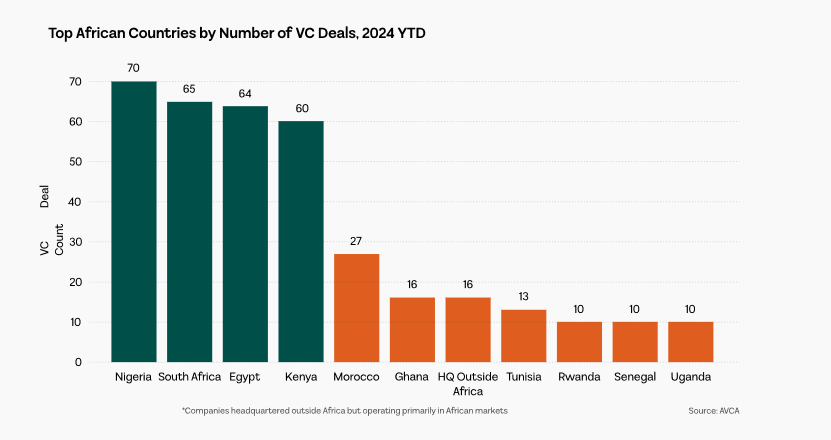
Deal activity remains concentrated in Nigeria, Kenya, Egypt, and South Africa, where digital infrastructure, talent pools, and investor networks are most developed. However, emerging hubs such as Senegal, Morocco, Rwanda, and Ghana are beginning to attract capital, indicating gradual geographic diversification.
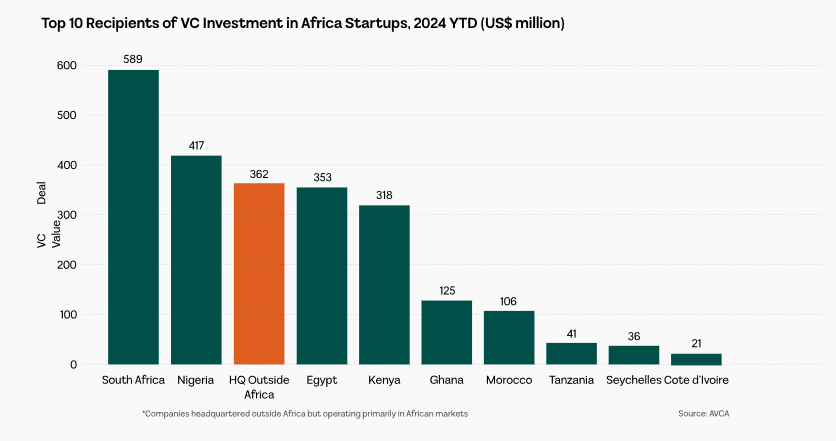
Recipients of Venture Capital Deals in Africa
Top African countries by Venture Capital Deals
Africa’s venture landscape remains highly concentrated, with Nigeria, Kenya, Egypt, and South Africa accounting for the bulk of startup activity and capital inflows. Although these four markets were already dominant five years ago, their lead has strengthened due to deeper investor networks, maturing tech ecosystems, and a higher density of scalable ventures.
Investment stage composition has also evolved. Earlier cycles were dominated by seed and Series A rounds. Today, a growing share of capital is flowing into growth and late-stage deals. Venture debt, while still a small segment, is expanding as an alternative source of funding, helping scaling firms preserve equity while extending runway. Together, these trends point to a market that is increasingly able to support follow-on capital, structured financing, and institutional-scale exits.
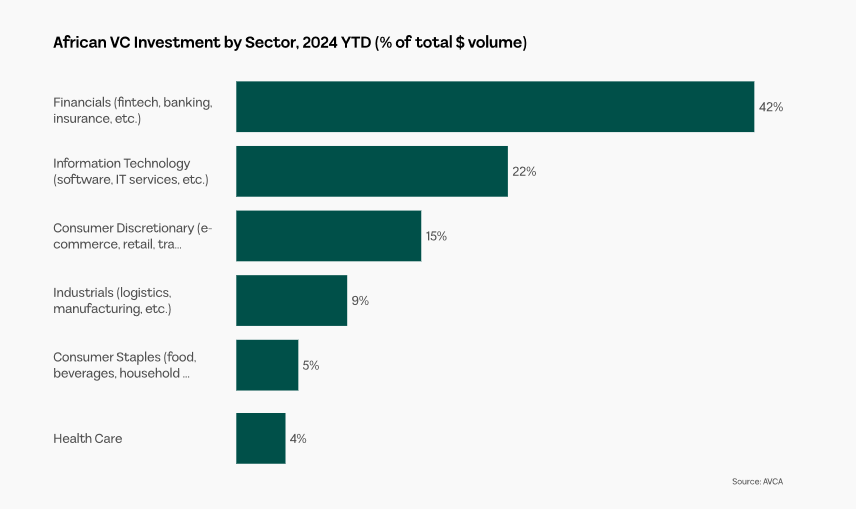
VC Investment by Sector
Infrastructure and Real Assets: Long-Duration Cash Flows
Infrastructure and real assets anchor Africa’s alternatives market, providing stable, inflation-linked cash flows tied to essential services. Over the past five years, investment has shifted decisively toward renewable energy, integrated transport systems, and digital infrastructure.
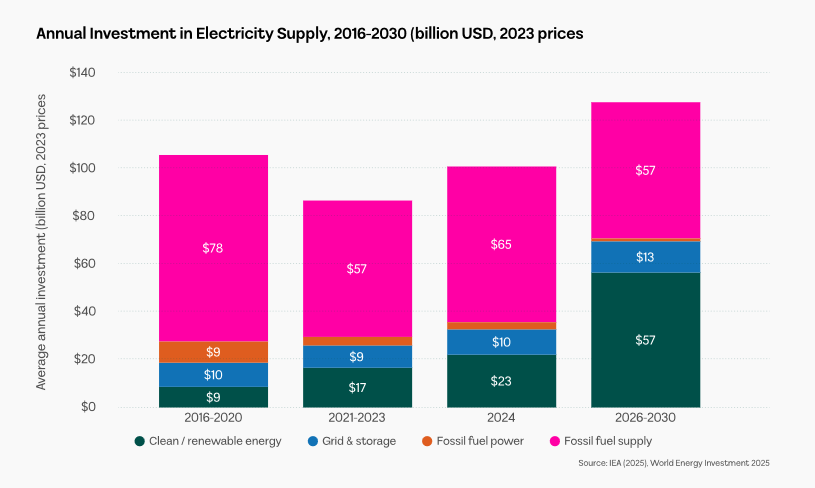
Renewables now dominate new project pipelines, driven by declining technology costs, climate finance flows, and strong development finance institution participation. Solar and wind, alongside mini-grid and off-grid systems, are expanding quickly as grid reliability remains uneven. Even so, the energy gap is wide. Africa still needs to add roughly 16 GW of grid capacity each year just to meet baseline demand growth.
Annual Investment in Electricity Supply
Africa’s venture landscape remains highly concentrated, with Nigeria, Kenya, Egypt, and South Africa accounting for the bulk of startup activity and capital inflows. Although these four markets were already dominant five years ago, their lead has strengthened due to deeper investor networks, maturing tech ecosystems, and a higher density of scalable ventures.
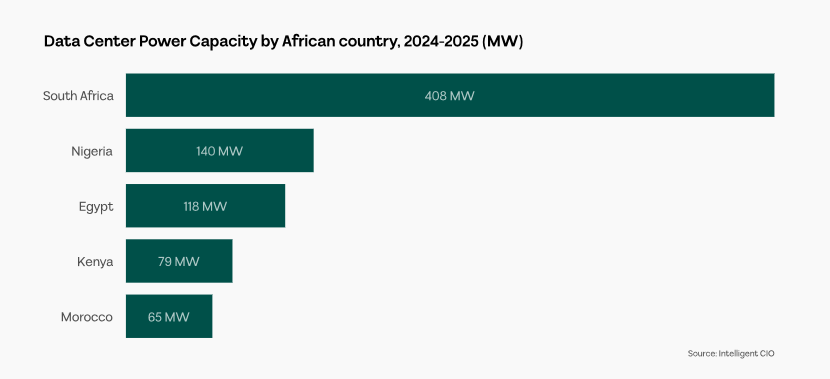
Digital infrastructure is also scaling quickly. Data center capacity is rising alongside fiber rollout and cloud adoption, though access remains uneven and power constraints continue to limit expansion in several markets.
Data center power capacity by African countries
ESG, Impact, and Sustainable Finance
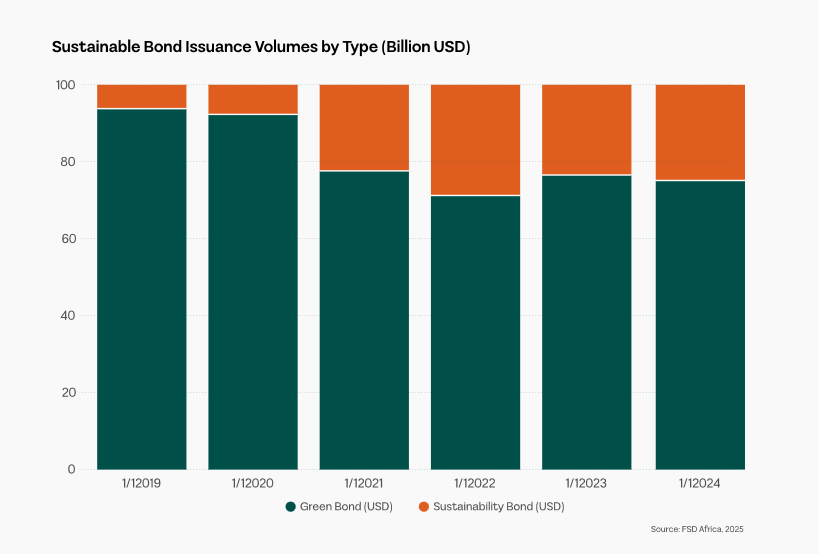
Environmental, social, and governance considerations have transitioned from the margin to mainstream investment criteria within African alternative assets. Green bond issuance remains limited, with the continent representing only USD 5.1 billion of the global USD 2.2 trillion green bond market according to the Africa Policy Research Institute. However, sustainability-linked loans and ESG-focused private equity strategies have gained significant traction, particularly in energy, agriculture, and infrastructure sectors.
Global Sustainable Bond Issuance by Instrument Type
Sustainable finance is increasingly aligned with Africa’s development priorities, particularly renewable energy, climate-resilient infrastructure, inclusive finance, and digital access have emerged as primary investment themes. These efforts have cemented ESG as a structural feature of African investment markets, not a passing trend, strengthening accountability, improving measurement, and clarifying pathways for long-term capital deployment.
Regional Differentiation in Alternative Investments
Performance across Africa’s alternative investment landscape varies by region, shaped by differences in policy frameworks, infrastructure readiness, and capital absorption capacity. North and Southern Africa attract the largest shares of private infrastructure and real asset capital, supported by stronger institutions and deeper project pipelines. East Africa leads in growth-oriented alternatives, particularly renewable energy, digital infrastructure, and agribusiness. West Africa combines demographic scale with rising private participation, though infrastructure gaps persist. Central Africa remains underpenetrated despite its resource base, constrained by governance, financing, and project preparation challenges.
Risk-Adjusted Returns and Exit Dynamics
Alternative assets often outperform public markets on a gross basis, but risk-adjusted returns hinge on execution, governance, and exit timing. Exits are uneven, dominated by trade sales and secondary transactions, with IPOs limited. Longer holding periods highlight the need for patient capital. Compared with public markets, alternatives show lower mark-to-market volatility but higher idiosyncratic and liquidity risk, with returns driven increasingly by operational improvements, scale, and long-term demand rather than financial engineering.
Outlook for Alternatives
Africa’s alternatives landscape is entering a phase of consolidation and institutionalization. Private capital is expected to play a growing role in financing infrastructure, energy transition, digital connectivity, and scalable enterprises, particularly as public balance sheets remain constrained. Returns are likely to remain attractive for investors able to manage illiquidity, regulatory risk, and execution complexity.
The long-term investment case rests on structural demand, demographic growth, and improving institutional frameworks. However, success will increasingly depend on selectivity, regional differentiation, strong local partnerships, and disciplined capital deployment.
Risk, Correlation, and Portfolio Construction
Africa’s investment landscape is defined as much by risk differentiation as by return potential.
Understanding how African asset classes correlate with each other and with global markets is essential for effective portfolio construction, particularly for investors seeking diversification rather than pure alpha.
Correlation Across African Asset Classes
Correlation patterns across African asset classes remain relatively low compared to developed markets, reflecting structural fragmentation, currency heterogeneity, and uneven market integration. Equities, local-currency bonds, hard-currency sovereign debt, real assets, and private capital often respond to different macro drivers.
African equities are primarily influenced by domestic growth dynamics, currency movements, and sector concentration, while sovereign bonds are driven by fiscal credibility, inflation expectations, and external financing conditions. Real assets such as infrastructure and real estate exhibit weaker short-term correlation with public markets, given their long-term cash-flow structures and regulated revenue models.
Private equity and infrastructure investments, in particular, demonstrate low correlation with listed equities and bonds due to valuation smoothing, illiquidity, and project-specific risk profiles. This segmentation creates opportunities for multi-asset portfolios to reduce overall volatility when African assets are combined thoughtfully rather than treated as a single risk bucket.
Africa’s Diversification Benefits in Global Portfolios
From a global perspective, African assets offer meaningful diversification benefits, especially for investors concentrated in developed markets. Correlations between African equities and major global indices remain low to moderate, reflecting limited financial integration and distinct economic cycles.
Hard-currency African sovereign bonds show higher correlation with global emerging-market debt, particularly during periods of global risk-off sentiment. However, country-specific fundamentals such as debt structure, IMF engagement, and export composition continue to drive dispersion in performance.
Real assets and private capital provide the strongest diversification benefits, as returns are more closely linked to demographic trends, infrastructure gaps, and structural transformation rather than global monetary cycles. For long-term investors, Africa’s diversification value lies less in short-term hedging and more in exposure to differentiated growth drivers unavailable in mature markets.
Political, Regulatory, and Liquidity Risk
Political and regulatory risks remain central considerations in African portfolio construction. Policy uncertainty, election cycles, and changes in fiscal regimes can materially affect asset performance, particularly in sovereign debt and regulated sectors such as energy, telecoms, and infrastructure.
Liquidity risk is especially pronounced in African equity and bond markets. Thin trading volumes, limited market depth, and concentration among a small number of issuers can amplify volatility during periods of stress. These risks necessitate longer investment horizons, active management, and conservative position sizing.
For private and real assets, regulatory clarity, contract enforceability, and government counterpart risk are critical. While reforms have improved the investment climate in several countries, uneven institutional capacity continues to differentiate investable markets from high-risk jurisdictions.
ESG and Climate-Related Investment Risk
ESG and climate risks are increasingly material for African investments. Climate exposure particularly affects agriculture, energy, transport, and urban infrastructure, where droughts, floods, and heat stress can disrupt cash flows and asset values.
Governance risks remain the most significant ESG concern, influencing investor confidence, capital costs, and exit prospects. Weak disclosure standards, inconsistent enforcement, and political interference can elevate risk premiums.
At the same time, Africa’s ESG risk profile also presents opportunity. Investments aligned with climate resilience, renewable energy, digital inclusion, and sustainable infrastructure are increasingly favored by global capital, positioning ESG not only as a risk lens but as a return driver in portfolio construction.
2026 Outlook and Investment Scenarios
Africa’s investment outlook for 2026 will be shaped by global monetary conditions, commodity cycles, domestic reform momentum, and geopolitical developments. Scenario analysis provides a framework for understanding how asset classes and regions may respond under different macro paths.
Base Case Scenario
In the base case, easing global inflation allows advanced economies to begin gradual monetary easing, improving liquidity and supporting steady capital flows into Africa without fuelling excessive risk-taking.
African equities are expected to deliver moderate, earnings-driven returns, supported by improving fundamentals and currency stability in key markets. Local-currency bonds benefit from slower inflation and stronger policy credibility, while selective hard-currency sovereign debt opportunities exist where restructuring risks are limited.
Private capital and infrastructure investments remain resilient, driven by steady demand for energy, transport, digital infrastructure, and urban services. Fundraising improves modestly, with development finance institutions and blended-finance structures continuing to play a key catalytic role.
Upside Scenario
In an upside scenario driven by earlier global rate cuts, higher commodity prices, and faster domestic reforms investor confidence across African markets rises. FX stability and valuation re-ratings boost equity returns, especially in financials, consumer sectors, and telecommunications.
Local-currency bonds benefit from easing inflation and currency appreciation, while infrastructure and private equity gain from stronger deal flow, improved exits, and better operational performance. Countries with credible reforms, diversified economies, and improving governance attract more capital, widening regional performance gaps and reinforcing market differentiation.
Downside Scenario
In a downside scenario triggered by global tightening, geopolitical shocks, or falling commodity prices capital flows pull back, currencies weaken, and financing conditions tighten. Hard-currency sovereign debt is most at risk, especially in highly indebted countries with limited fiscal buffers. Equities see valuation compression, and liquidity risk rises sharply. Private capital slows as fundraising stalls and exits take longer.
Infrastructure assets with strong contracts and hard-currency revenues remain relatively defensive, emphasizing the importance of careful asset selection.
Asset Classes Most Sensitive to Macro Changes
Hard-currency bonds and listed equities are the most sensitive to global financial conditions, while local-currency bonds are highly exposed to inflation and FX dynamics. Real assets and private capital are less volatile but more sensitive to regulatory and execution risk.
Countries and Sectors to Watch
Nigeria, Egypt, Kenya, South Africa, and Morocco remain systemically important, while emerging opportunities are appearing in Senegal, Rwanda, Ghana, and Namibia. Across the continent, the most promising sectors include renewable energy, digital infrastructure, logistics, financial services, and climate-resilient agriculture.
Balancing Short-Term Opportunities and Long-Term Value in Africa
Investors can take advantage of short-term valuation swings and cyclical rebounds. Strategically, however, Africa favors patient capital, those willing to focus on long-term structural themes, build local partnerships, and invest in assets with durable, long-duration returns.
Conclusions – Positioning for Africa’s Investment Cycle
Africa’s investment scene is starting to show clear differences across countries and sectors. Success now depends less on broad regional trends and more on strong policies, reliable institutions, and solid fundamentals in each market.
Relative Attractiveness of Asset Classes
Private capital, infrastructure, and real assets stand out for long-term, risk-adjusted returns, due to strong structural demand and low correlation with global markets. Equities can deliver selective gains when earnings growth and currency stability line up, while fixed income performs best with careful, country-by-country selection.
Risk–Return Trade-offs and Timing Considerations
Higher returns in Africa come with elevated risks, including political, liquidity, and execution challenges.
While timing can influence outcomes, careful asset selection and investment structure are even more important. Investors who enter during periods of market dislocation and maintain a long-term perspective are best positioned to capture upside.
What Type of Investor Each Asset Class Suits
Public equities and bonds are best suited for investors with higher risk tolerance and shorter horizons. Infrastructure and real assets appeal to long-term, yield-focused investors seeking inflation protection. Private equity and venture capital are ideal for patient investors with strong local networks who can manage illiquidity.
Key Signals for Reallocating Capital in 2026
Investors should watch for signals such as FX stability, inflation trends, IMF engagement, fiscal reforms, election outcomes, and progress on infrastructure and energy projects. Positive movement in these areas often precedes sustained asset re-pricing. Africa should not be viewed as a single trade but as a collection of diverse opportunities. Investors who approach the continent with discipline, local insight, and a long-term perspective are best positioned to capture value in the next investment cycle.
References
African Development Bank (AfDB). (2025). Africa’s Macroeconomic Performance and Outlook 2025. Abidjan:
AfDB
International Monetary Fund (IMF). (2025). World Economic Outlook: Balancing Growth and Stability.
Washington, DC: IMF
United Nations Conference on Trade and Development (UNCTAD). (2025). Handbook of Statistics 2025.
Geneva: UNCTAD
United Nations Department of Economic and Social Affairs (UN DESA). (2024). World Population Prospects
2024. New York: United Nations
World Bank. (2025). Africa’s Pulse, No. 32 (October 2025): Pathways to Job Creation in Africa. Washington, DC:
World Bank
African Development Bank (AfDB). (2025). African Economic Outlook: Macroeconomic Performance and
Prospects 2025–26. Abidjan: AfDB
International Monetary Fund (IMF). (2025). World Economic Outlook: Global Economy in Flux, October 2025.
Washington, DC: IMF
World Bank. (2025). Africa’s Pulse: Navigating Global Uncertainty, April 2025 Edition. Washington, DC: World
Bank
Organization for Economic Co-operation and Development (OECD). (2025). Development Aid Statistics 2025.
Paris: OECD
World Bank. (2025). Africa’s Pulse: Navigating Global Uncertainty. Washington, DC: World Bank
African Development Bank (AfDB). (2025). African Economic Outlook 2025
Central Bank of Nigeria (CBN). (2025). Monetary Policy Report, Q2 2025
International Monetary Fund (IMF). (2025). Nigeria Staff Report for the 2025 Article IV Consultation
Africa Grow tracks Africa’s growth engines in a changing global economy is an integrated analytical view of Africa’s development trajectory. The report responds to the unification of fast population growth,…
We use cookies on our website to upgrade your experience. By clicking “Accept”, you consent to the use of all the cookies. However, you may visit "Cookie Settings" to tailor your consent.
This website uses cookies to improve your experience while you navigate through the website. Out of these, the cookies that are categorized as necessary are stored on your browser as they are essential for the working of basic functionalities of the website. We also use third-party cookies that help us analyze and understand how you use this website. These cookies will be stored in your browser only with your consent. You also have the option to opt-out of these cookies. But opting out of some of these cookies may affect your browsing experience.
Necessary cookies are absolutely essential for the website to function properly. These cookies ensure basic functionalities and security features of the website, anonymously.
Cookie
Duration
Description
cookielawinfo-checkbox-analytics
11 months
This cookie is set by GDPR Cookie Consent plugin. The cookie is used to store the user consent for the cookies in the category "Analytics".
cookielawinfo-checkbox-functional
11 months
The cookie is set by GDPR cookie consent to record the user consent for the cookies in the category "Functional".
cookielawinfo-checkbox-necessary
11 months
This cookie is set by GDPR Cookie Consent plugin. The cookies is used to store the user consent for the cookies in the category "Necessary".
cookielawinfo-checkbox-others
11 months
This cookie is set by GDPR Cookie Consent plugin. The cookie is used to store the user consent for the cookies in the category "Other.
cookielawinfo-checkbox-performance
11 months
This cookie is set by GDPR Cookie Consent plugin. The cookie is used to store the user consent for the cookies in the category "Performance".
viewed_cookie_policy
11 months
The cookie is set by the GDPR Cookie Consent plugin and is used to store whether or not user has consented to the use of cookies. It does not store any personal data.
Functional cookies help to perform certain functionalities like sharing the content of the website on social media platforms, collect feedbacks, and other third-party features.
Performance cookies are used to understand and analyze the key performance indexes of the website which helps in delivering a better user experience for the visitors.
Analytical cookies are used to understand how visitors interact with the website. These cookies help provide information on metrics the number of visitors, bounce rate, traffic source, etc.
Advertisement cookies are used to provide visitors with relevant ads and marketing campaigns. These cookies track visitors across websites and collect information to provide customized ads.